.svg)


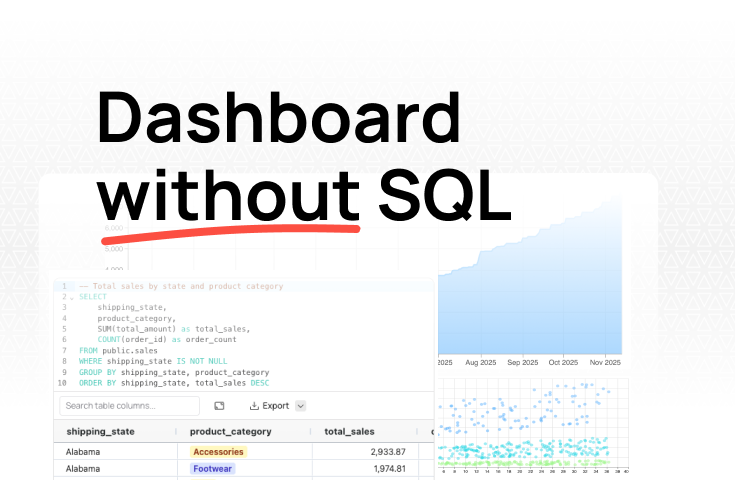
How to build dashboards without writing SQL and your best options to get started quickly.

The traditional analytics stack—warehouse, ETL pipelines, BI tool, data engineer—was never a requirement. It was a consequence of the tools that existed before AI. Today, AI-native platforms handle what used to require months of setup and $2,000–$5,000 in monthly tooling costs before a single useful dashboard appeared. Connect your data, ask questions in plain English, and get working charts in hours. You don't need a data team to get started. You need the right platform.
Every business needs data to run. But not every business can afford the obnoxious up-front costs involved in spinning up a simple dashboard.
That's the uncomfortable paradox facing small and mid-sized teams today. The companies that most need fast, reliable insights are often the ones least equipped to get them. That’s because the conventional path to data dashboards assumes you already have a data team, a configured warehouse, and months to spare before you see your first chart.
The traditional analytics stack was designed for enterprises with dedicated data engineers and analysts to maintain it. For startups and lean teams, that stack becomes a barrier before it ever becomes an asset.
The good news is that the conventional approach to building data dashboards is increasingly unnecessary. In this article, we’ll look at how AI-driven data dashboards accelerate time to insight and how to leverage them to get the best results.
The conventional wisdom around data infrastructure goes something like this: you need a place to store your data, a way to move and clean it, and a tool to visualize it.
Each layer is reasonable on its own. Together, they create a setup that can take months and thousands of dollars before a single stakeholder gets a useful insight.
The foundation is the data warehouse, a centralized repository optimized for analytical queries. Popular options include Snowflake, BigQuery, Databricks, and Redshift. Each requires configuration, schema design, and ongoing optimization as your datasets grow.
The hidden cost goes beyond the compute and storage bill. You also need someone who understands how to architect and maintain these systems. That usually means hiring a data engineer before you've built anything useful.
On top of the warehouse sit the ETL (extract, transform, load) pipelines that pull data from your source systems and get it into the right format. Tools like Fivetran, Airbyte, and dbt handle different parts of this process.
But each new data source typically requires custom integration work, and pipelines break whenever source schemas change. Maintenance becomes a part-time job before your business has outgrown a shared spreadsheet.
Finally comes the analytics layer. These are the BI tools most people recognize: Tableau, Power BI, Looker. These platforms handle data visualization and dashboard building.
Each one, however, comes with its own learning curve. Looker requires LookML modeling before users can explore data. Power BI's DAX expressions are not intuitive outside the Microsoft ecosystem. Tableau's calculated fields take time to master. Building interactive dashboards in any of these tools means training your team on a specialized skill set on top of everything else.
Running the numbers makes for uncomfortable reading.
That's $2,000 to $5,000 in monthly tooling costs before you've hired a single person to run any of it. Oh, and an analytics engineer capable of managing this stack typically runs $80,000 to $150,000 annually.
Time costs are just as punishing. Standing up a basic analytics stack realistically takes two to three months minimum, plus another one to two months before the team is genuinely productive. Dashboard iteration after go-live still takes days or weeks per new report.
AI-native analytics platforms aren't traditional BI tools with a chatbot bolted on. They represent a fundamentally different architecture - one designed to eliminate the stack complexity that makes data dashboards inaccessible to resource-constrained teams.
An AI-native analytics platform handles data storage, transformation, and data visualization in a single environment. Data sources connect directly - whether that's a CRM, a SaaS tool, or a database - and the platform handles the integration work that used to require custom engineering. The result is that teams go from raw data to working dashboards in hours rather than months.
The AI layer handles what was previously one of the most tedious part of the workflow: translating business questions into SQL and Python. Business users can ask questions in plain English and get immediate answers. Technical users can review and refine the generated code, maintaining full transparency into how every analysis works. This greatly reduces the classic data engineering backlog.
This is an important distinction worth making explicit: AI doesn't fully replace data engineers. It handles the growing queue of routine, repetitive requests that data engineers spend a disproportionate amount of time on.
This means that, if you do have data engineers, using AI-native analytics frees them to focus on data architecture, governance, and the complex analytical problems that actually require deep expertise. Business users get self-service for pressing questions; engineers get their time back for high-value work.
Traditional BI tools also operate on an assumption that doesn't reflect how most businesses work: that your data is clean and your schemas are well-defined before analysis begins. AI-native platforms flip that assumption. They work with messy spreadsheets, raw CSV files, imperfect database tables, and your SaaS applications - iteratively improving data quality through use rather than demanding it as a prerequisite.
Resist the instinct to want everything in place before you start. Begin with the data you already have access to - spreadsheets, SaaS tool exports, operational database tables - and focus on your highest-impact questions rather than comprehensive data coverage.
In practice, this means picking one or two data sources and connecting them first. HubSpot to understand pipeline health, Google Analytics to website traffic, or Google Sheets data uploaded directly. The goal is to surface real, actionable insights immediately and learn what you actually need before building out anything comprehensive.
The right platform for teams without a dedicated data function supports, at a minimum:
This is where Fabi.ai is purpose-built for the problem. After connecting a data source, Fabi generates charts and tables with SQL and Python automatically based on your questions, displays the code transparently so anyone can verify and edit it, and publishes results as shareable dashboards in a few clicks.
Parasail's head of product described the learning curve as "four to five hours.” That’s one reason Fabi.ai enabled them to build reports 10x faster than before. Compare that to the months a traditional BI tool would have required to get a single dashboard live.
Start with dashboards that answer your most common questions. Then, watch what people actually ask rather than what you predicted they'd need.
Real usage patterns reveal which data sources are worth connecting next and which workflows are worth automating. Add data sources as specific needs arise, not preemptively.
This progressive approach pays dividends. Hologram's BI lead, for example, went from a day or two of turnaround on complex analyses to 30 minutes. This made it possible to handle more stakeholder requests, deliver richer metrics, and focus on strategic work rather than data preparation.
That's the compounding benefit of the iterative approach. The faster your team gets answers, the smarter the next set of questions becomes.
Self-service analytics handles the vast majority of routine reporting. These are the questions that repeat week over week, the KPIs stakeholders check before every meeting, and the dashboards that track core metrics in real-time.
But some scenarios genuinely require technical expertise:
For growing companies, the evolution path follows a natural arc. Self-service handles routine reporting first. The first data hire then optimizes the existing foundation and tackles complex questions that the platform surfaced but couldn't answer alone.
The team grows from there based on analytical complexity rather than reporting volume. The AI-native platform continues handling the routine workload that would otherwise require additional headcount.
When engineers join, they're improving architecture and solving hard problems, not rebuilding dashboards from scratch or untangling years of manual Excel exports. Everyone works at the top of their capability from day one.
The traditional analytics stack was never a requirement. It was a consequence of the tools that existed. Before AI could handle the translation layer between raw data and business insight, they were the only game in town.
AI-native platforms change that calculus entirely. A single tool now handles what used to require a warehouse, a pipeline, a BI platform, and a team of people to manage all three. Business stakeholders get self-service access to their most pressing questions. Data engineers, when you eventually hire them, focus on architecture and complex data analysis rather than fielding the same repetitive requests week after week.
The bottom line is, it no longer takes weeks to answer the questions you need to run your business. Sign up for Fabi.ai today and generate insights from your data in five minutes.