
.svg)


Dashboards & data apps
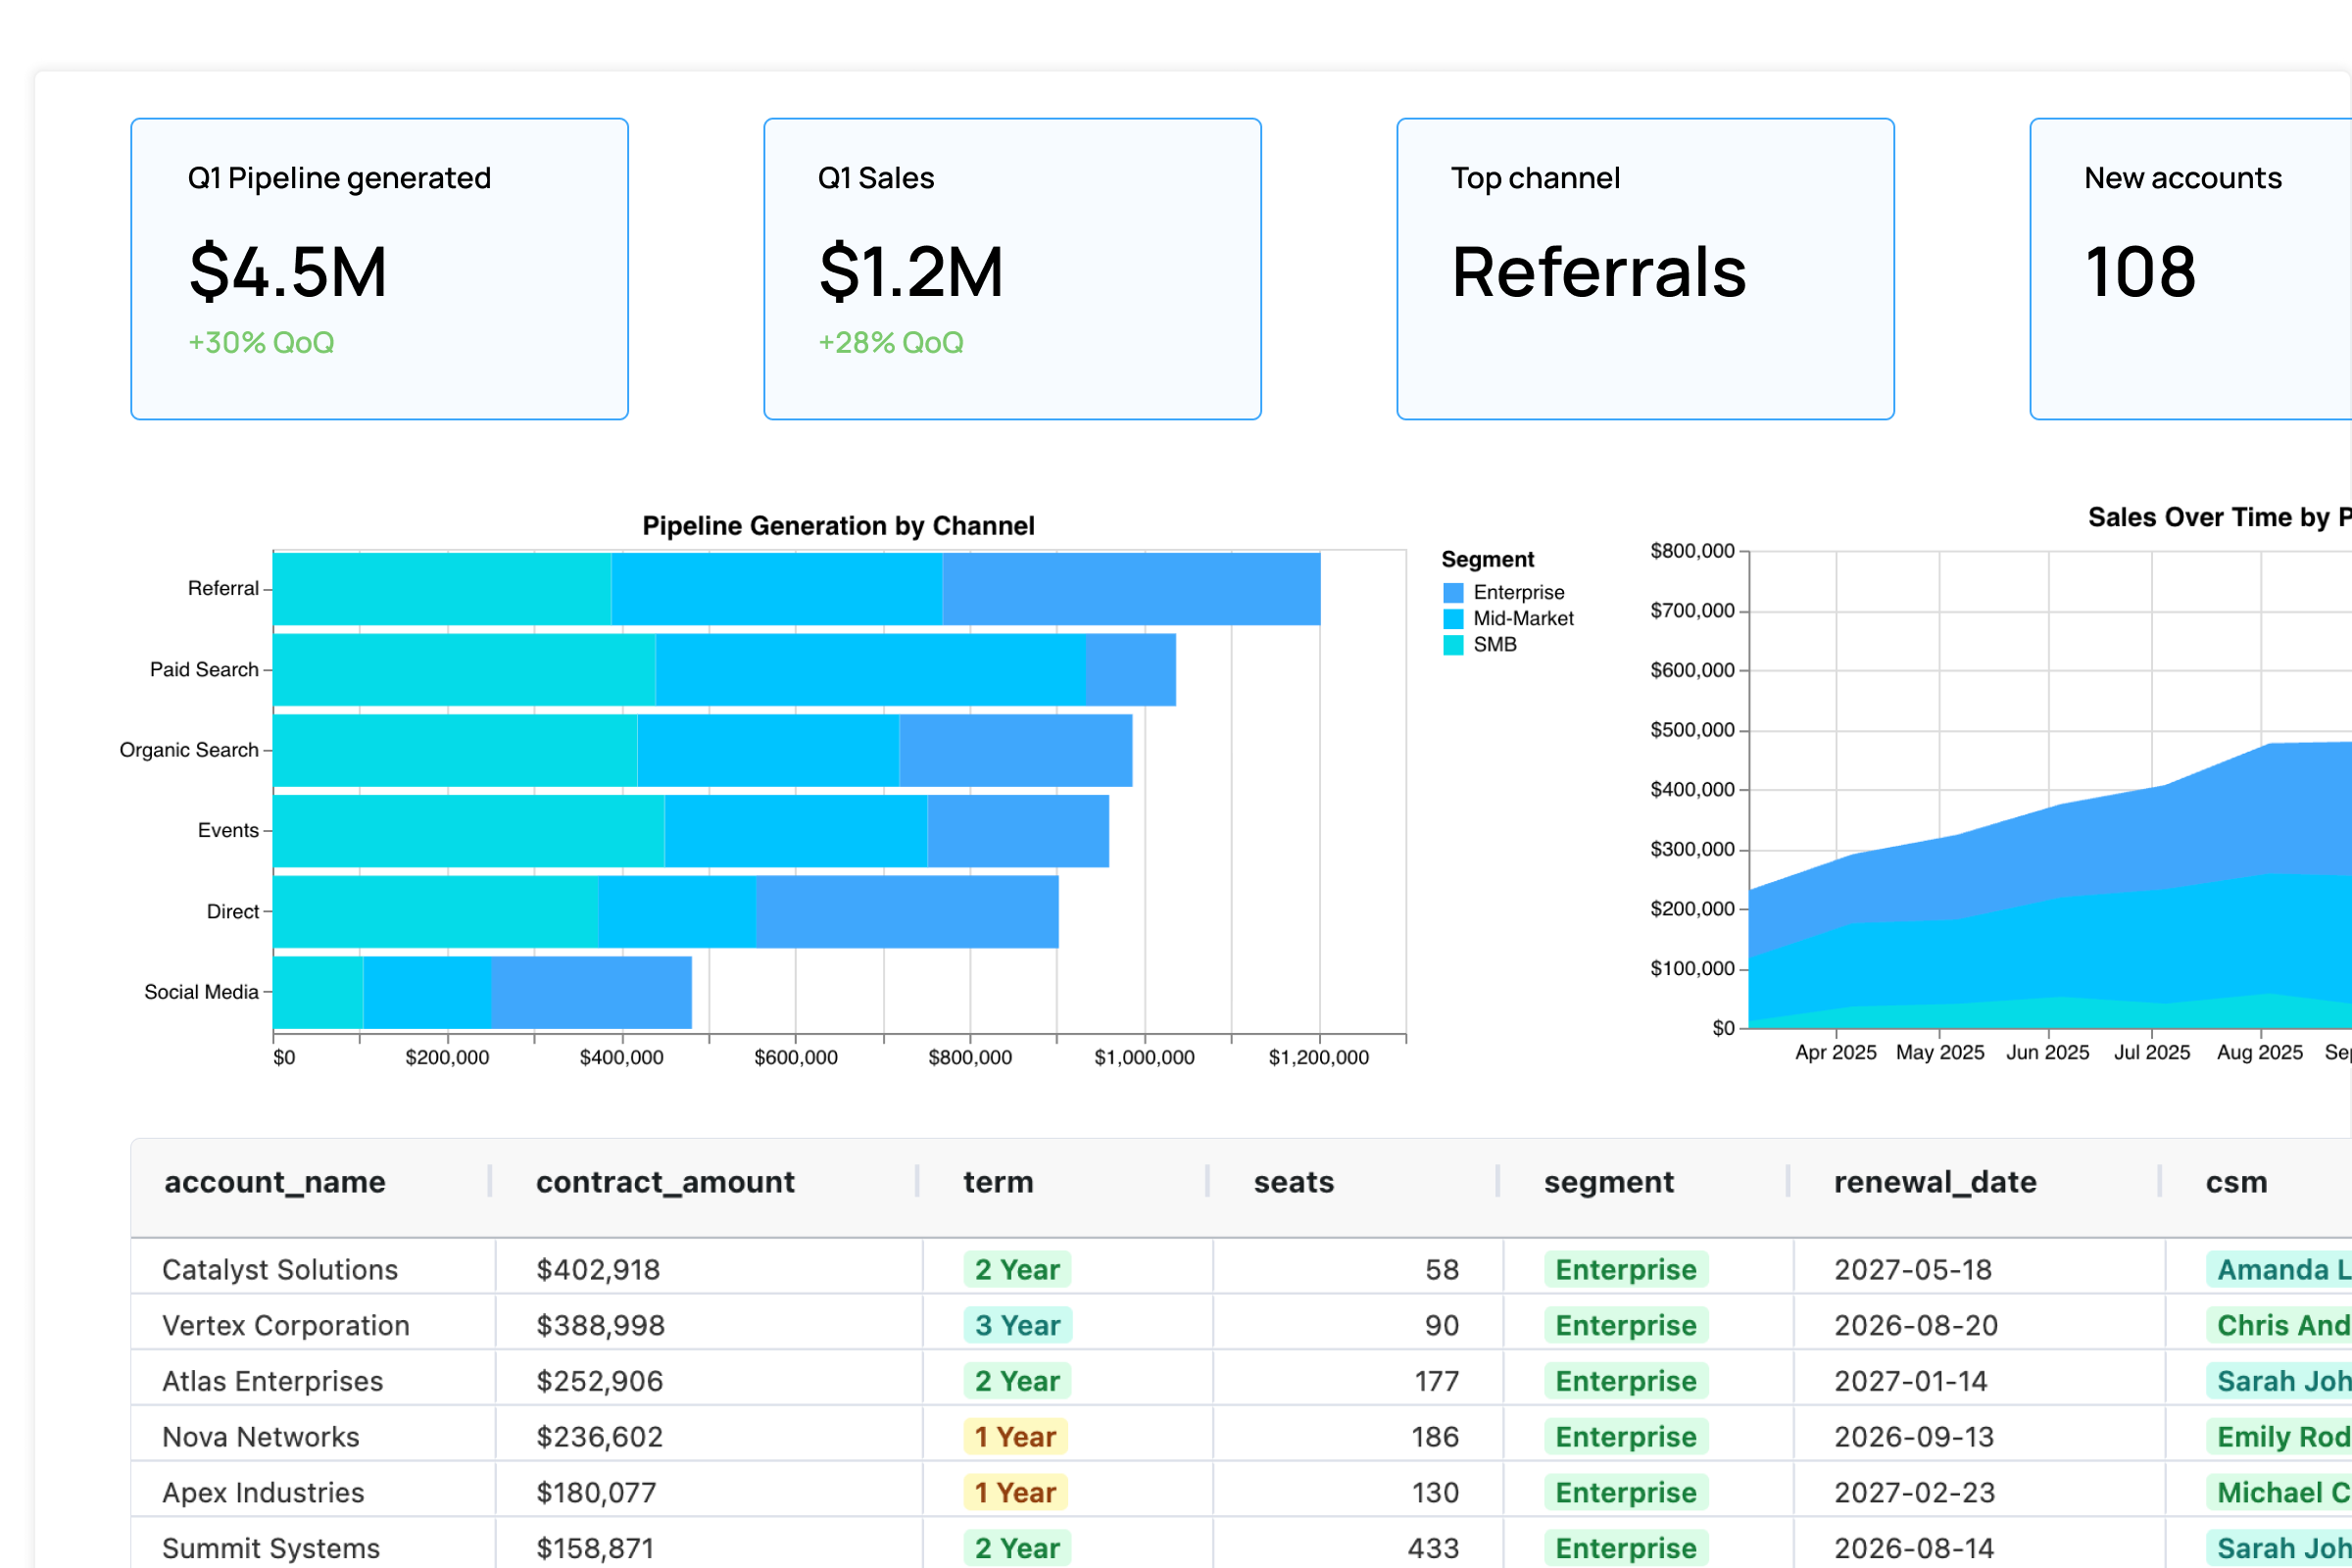
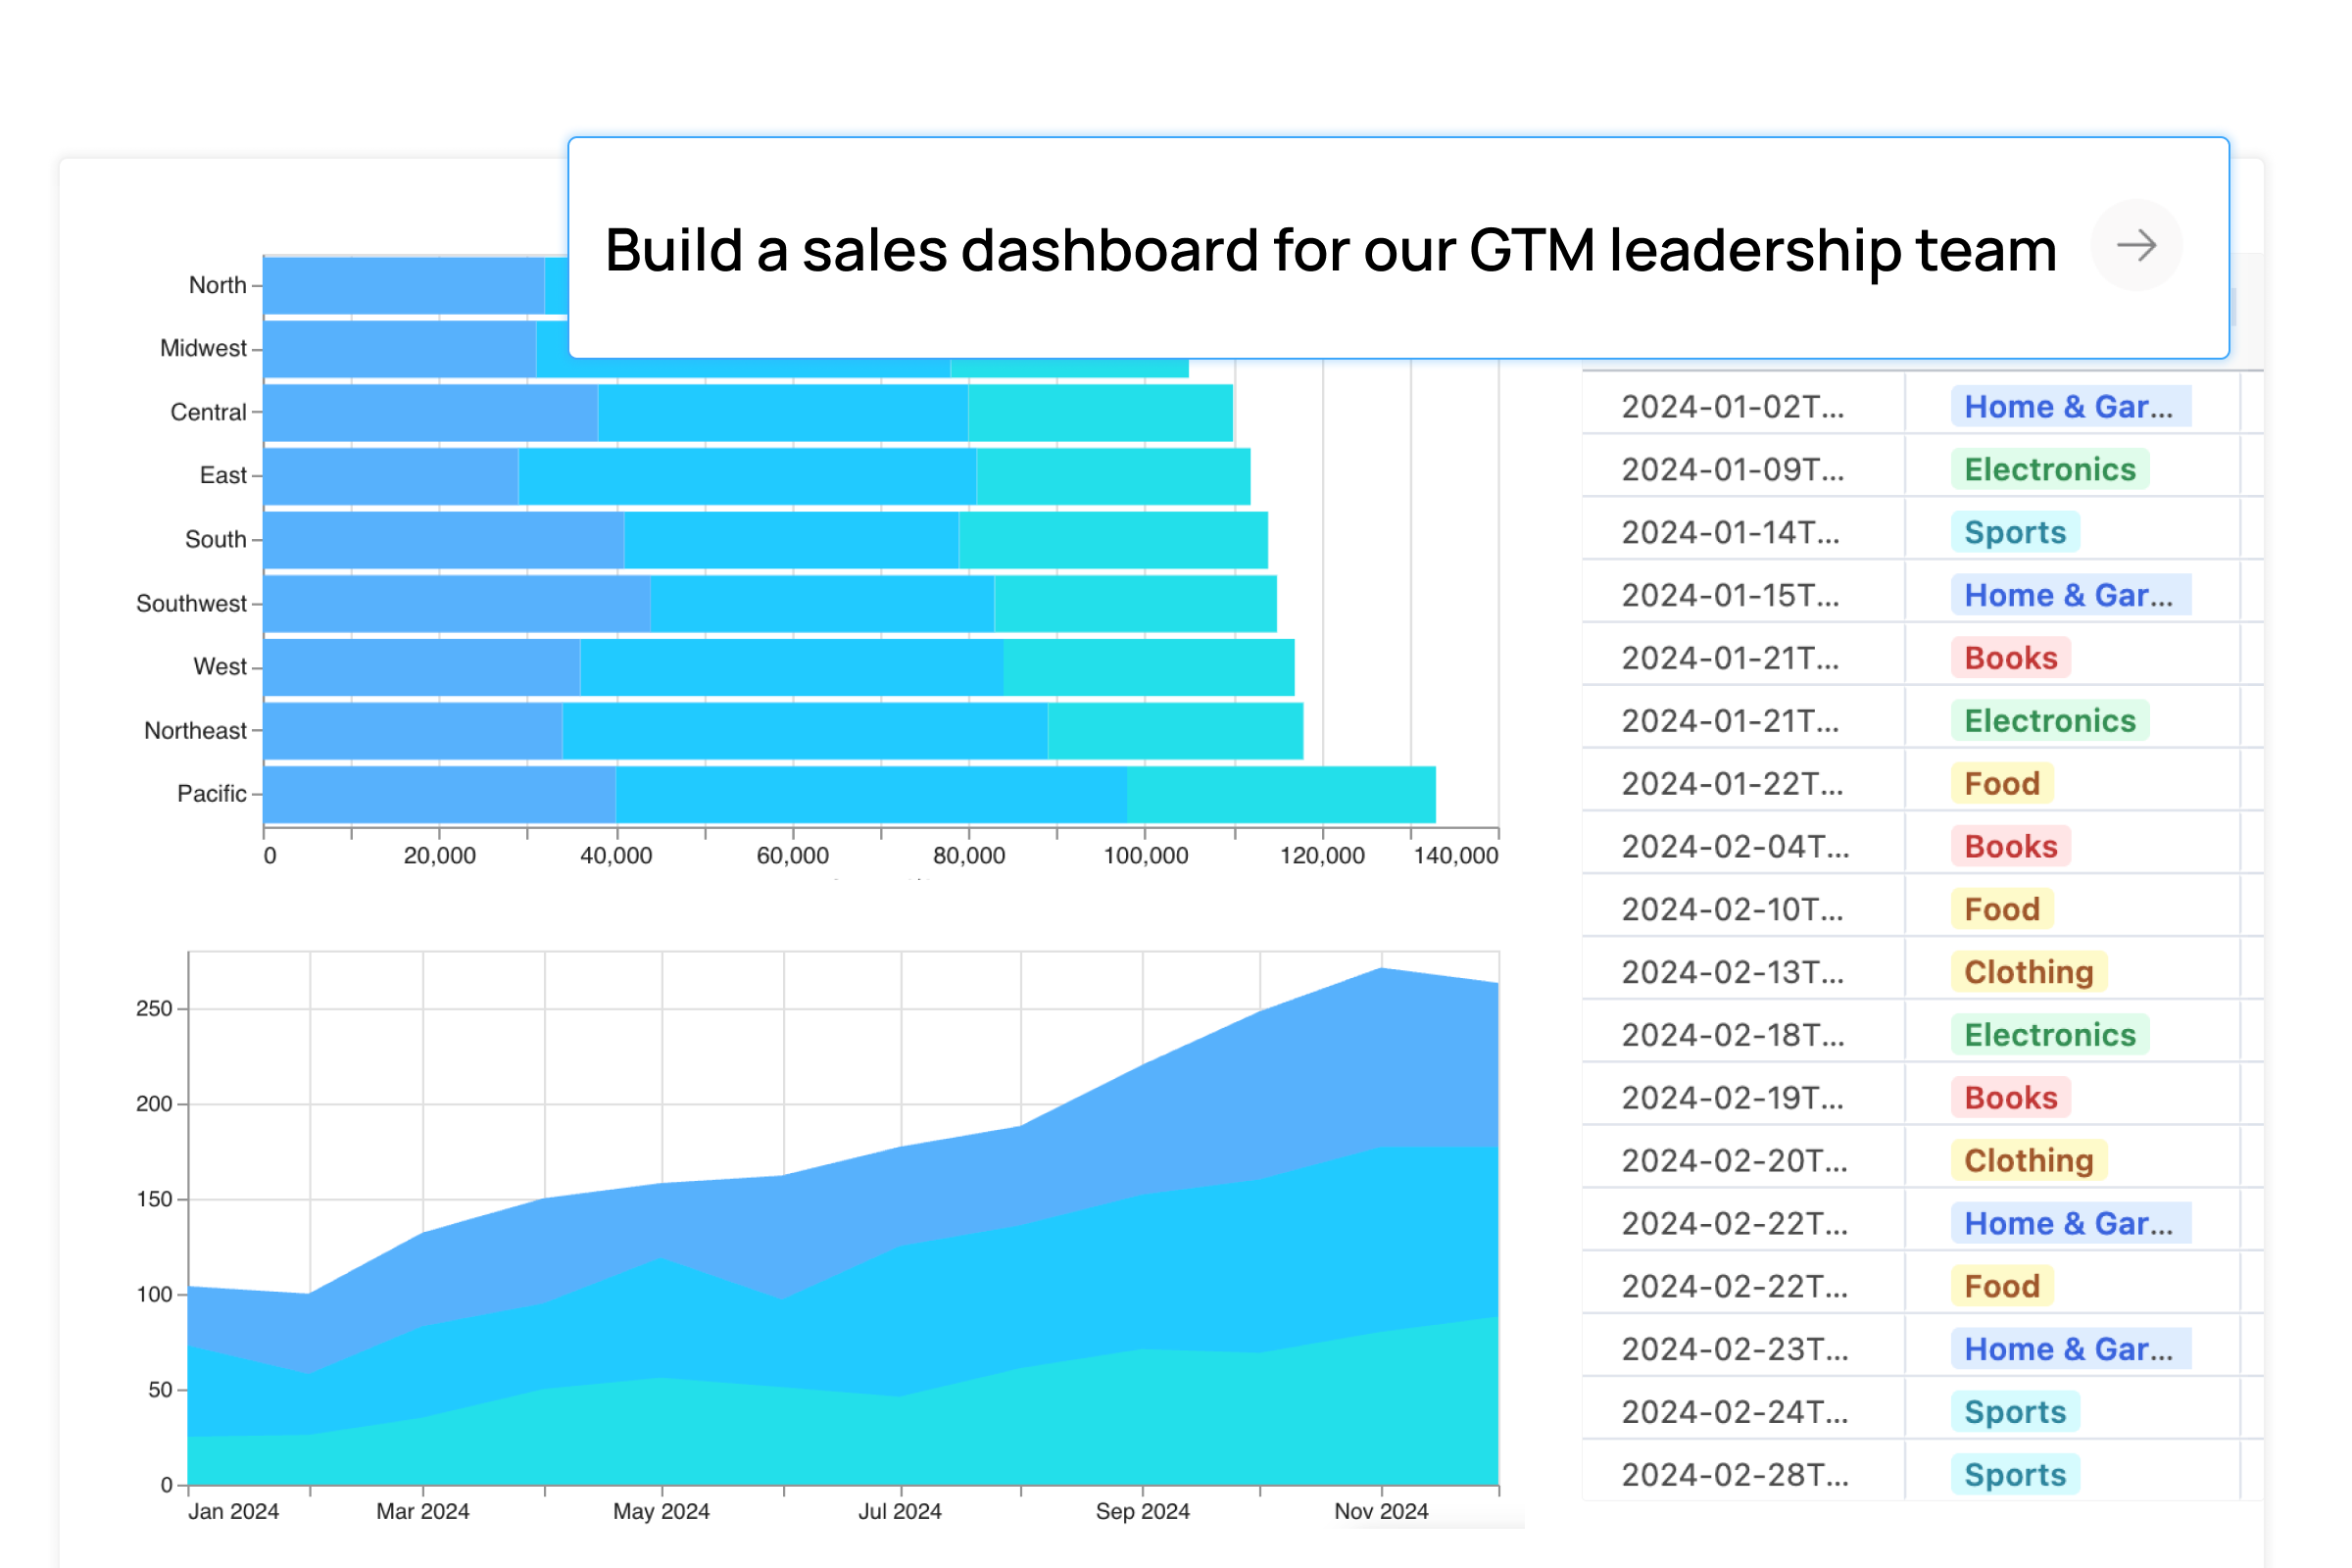
BI in the age of AI: Generate product and GTM dashboards
Loved by teams that deliver better, faster insights


.png)
.png)
.png)
.png)
.png)

.avif)


.png)


2010 dashboards
2026 dashboards

Constant requests for data updates and explanations.
Weeks or months to build out dashboards manually.
Static visualizations with limited context.
Dashboards could only be built by BI experts.

Self-serve data exploration with embedded AI.
Generate dashboards in a fraction of the time and effort.
Interactive elements and AI-assisted explanations
Self-service analytics for the entire team.
AI designed for business intelligence

Generative BI is finally here. Simply tell the Analyst Agent what you want to build and watch it do the work. Jump in and manually make any edits and stay in full control.
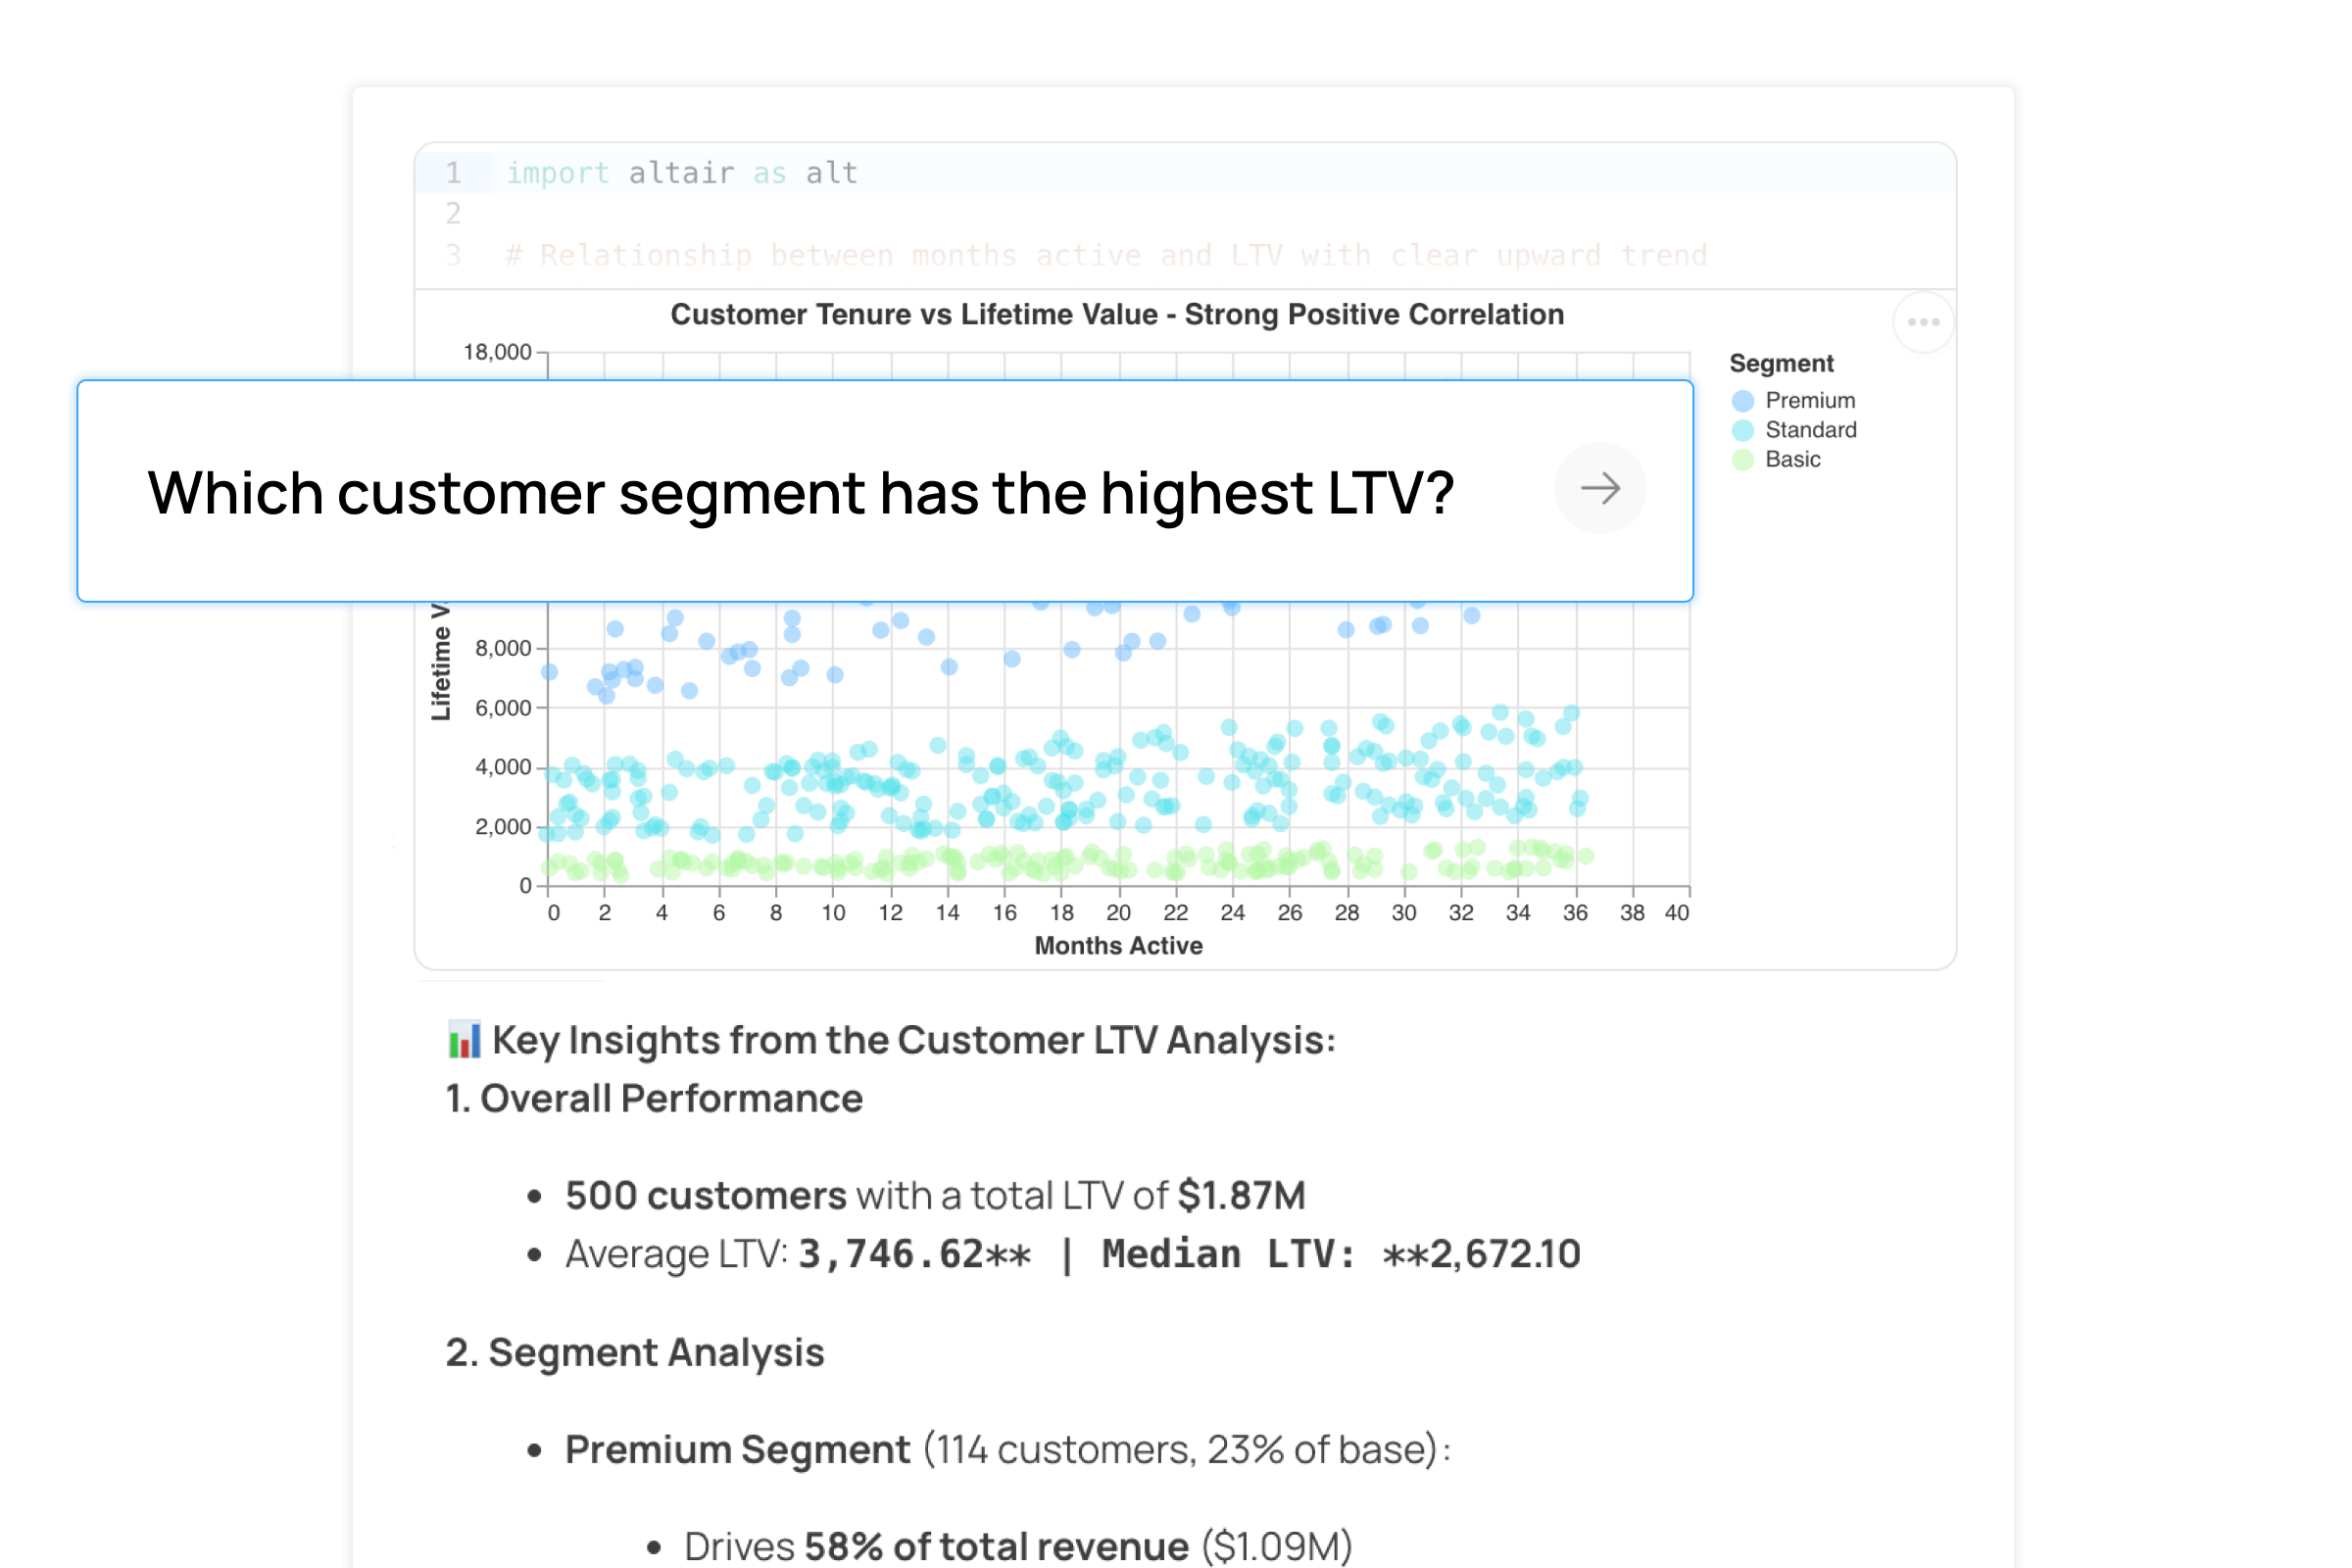
Give everyone in your business instant access to a personal data scientists to answer ad hoc questions or simply explore hunches.
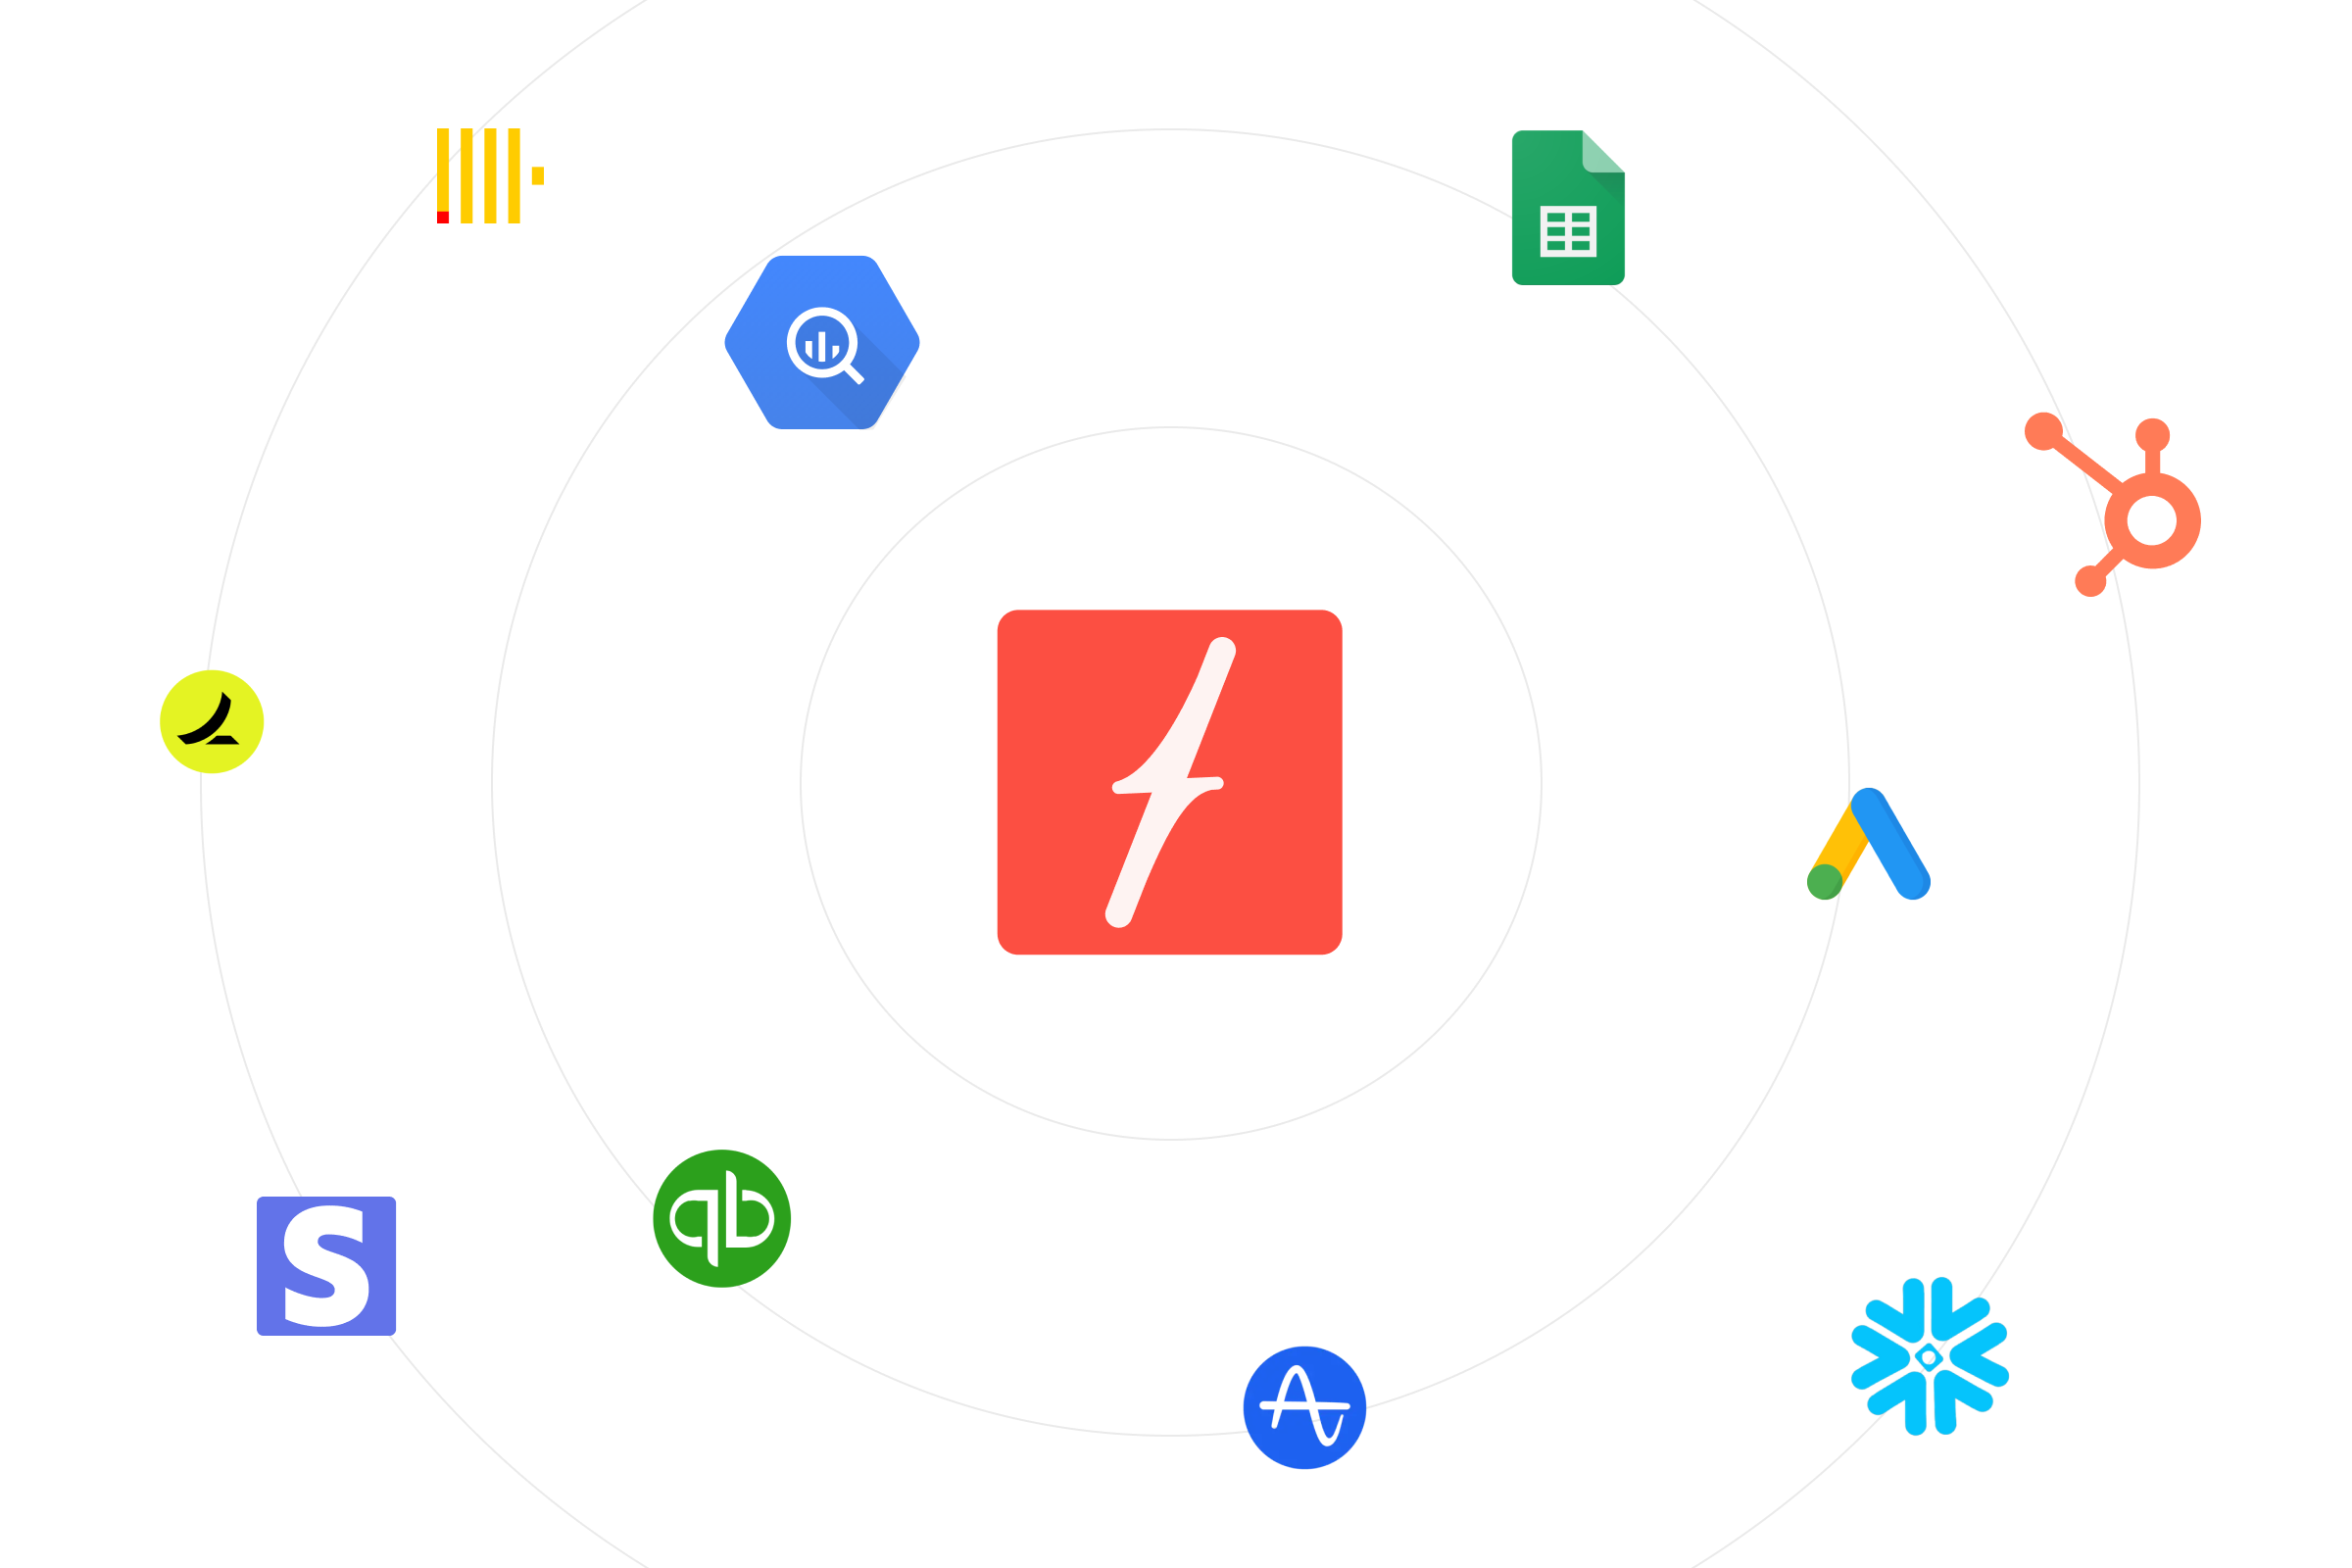
The only AI analyst that connects directly to all your business-critical product and GTM data sources.
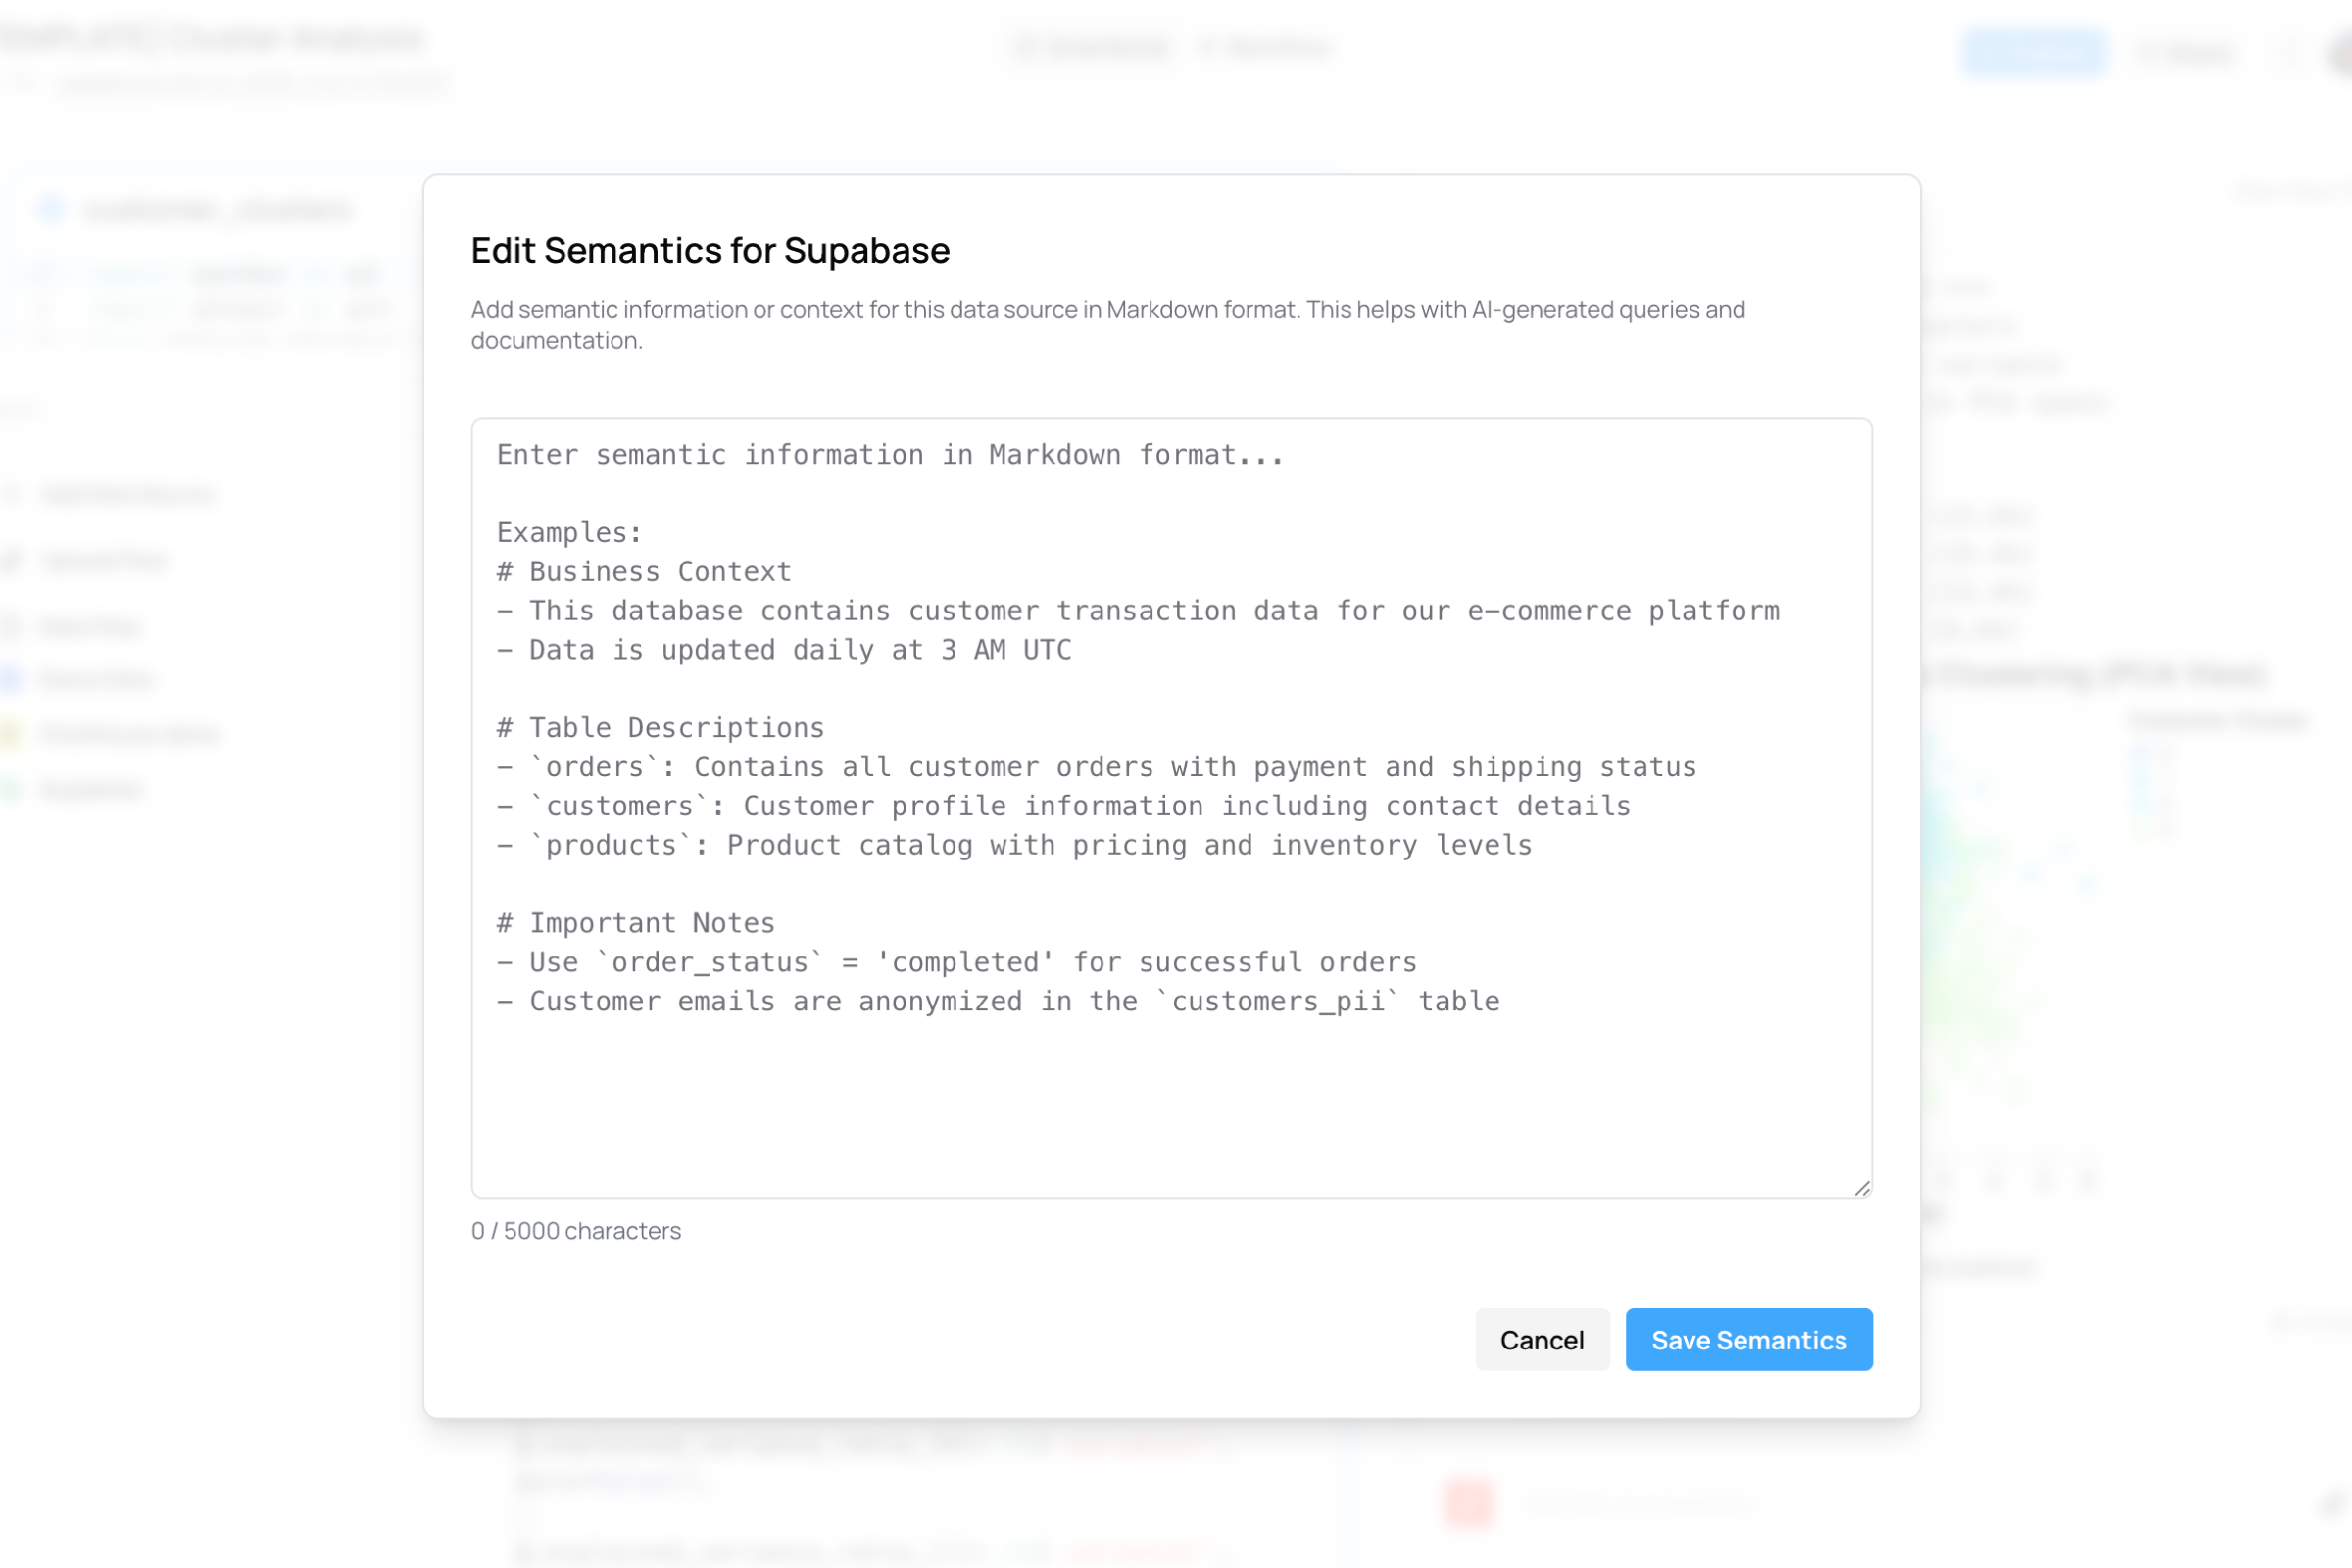
Stay in complete control at all times. Configure field and table access and provide additional context and semantics as needed or let the AI auto-learn. All in plain English, no PhD in data engineering required.
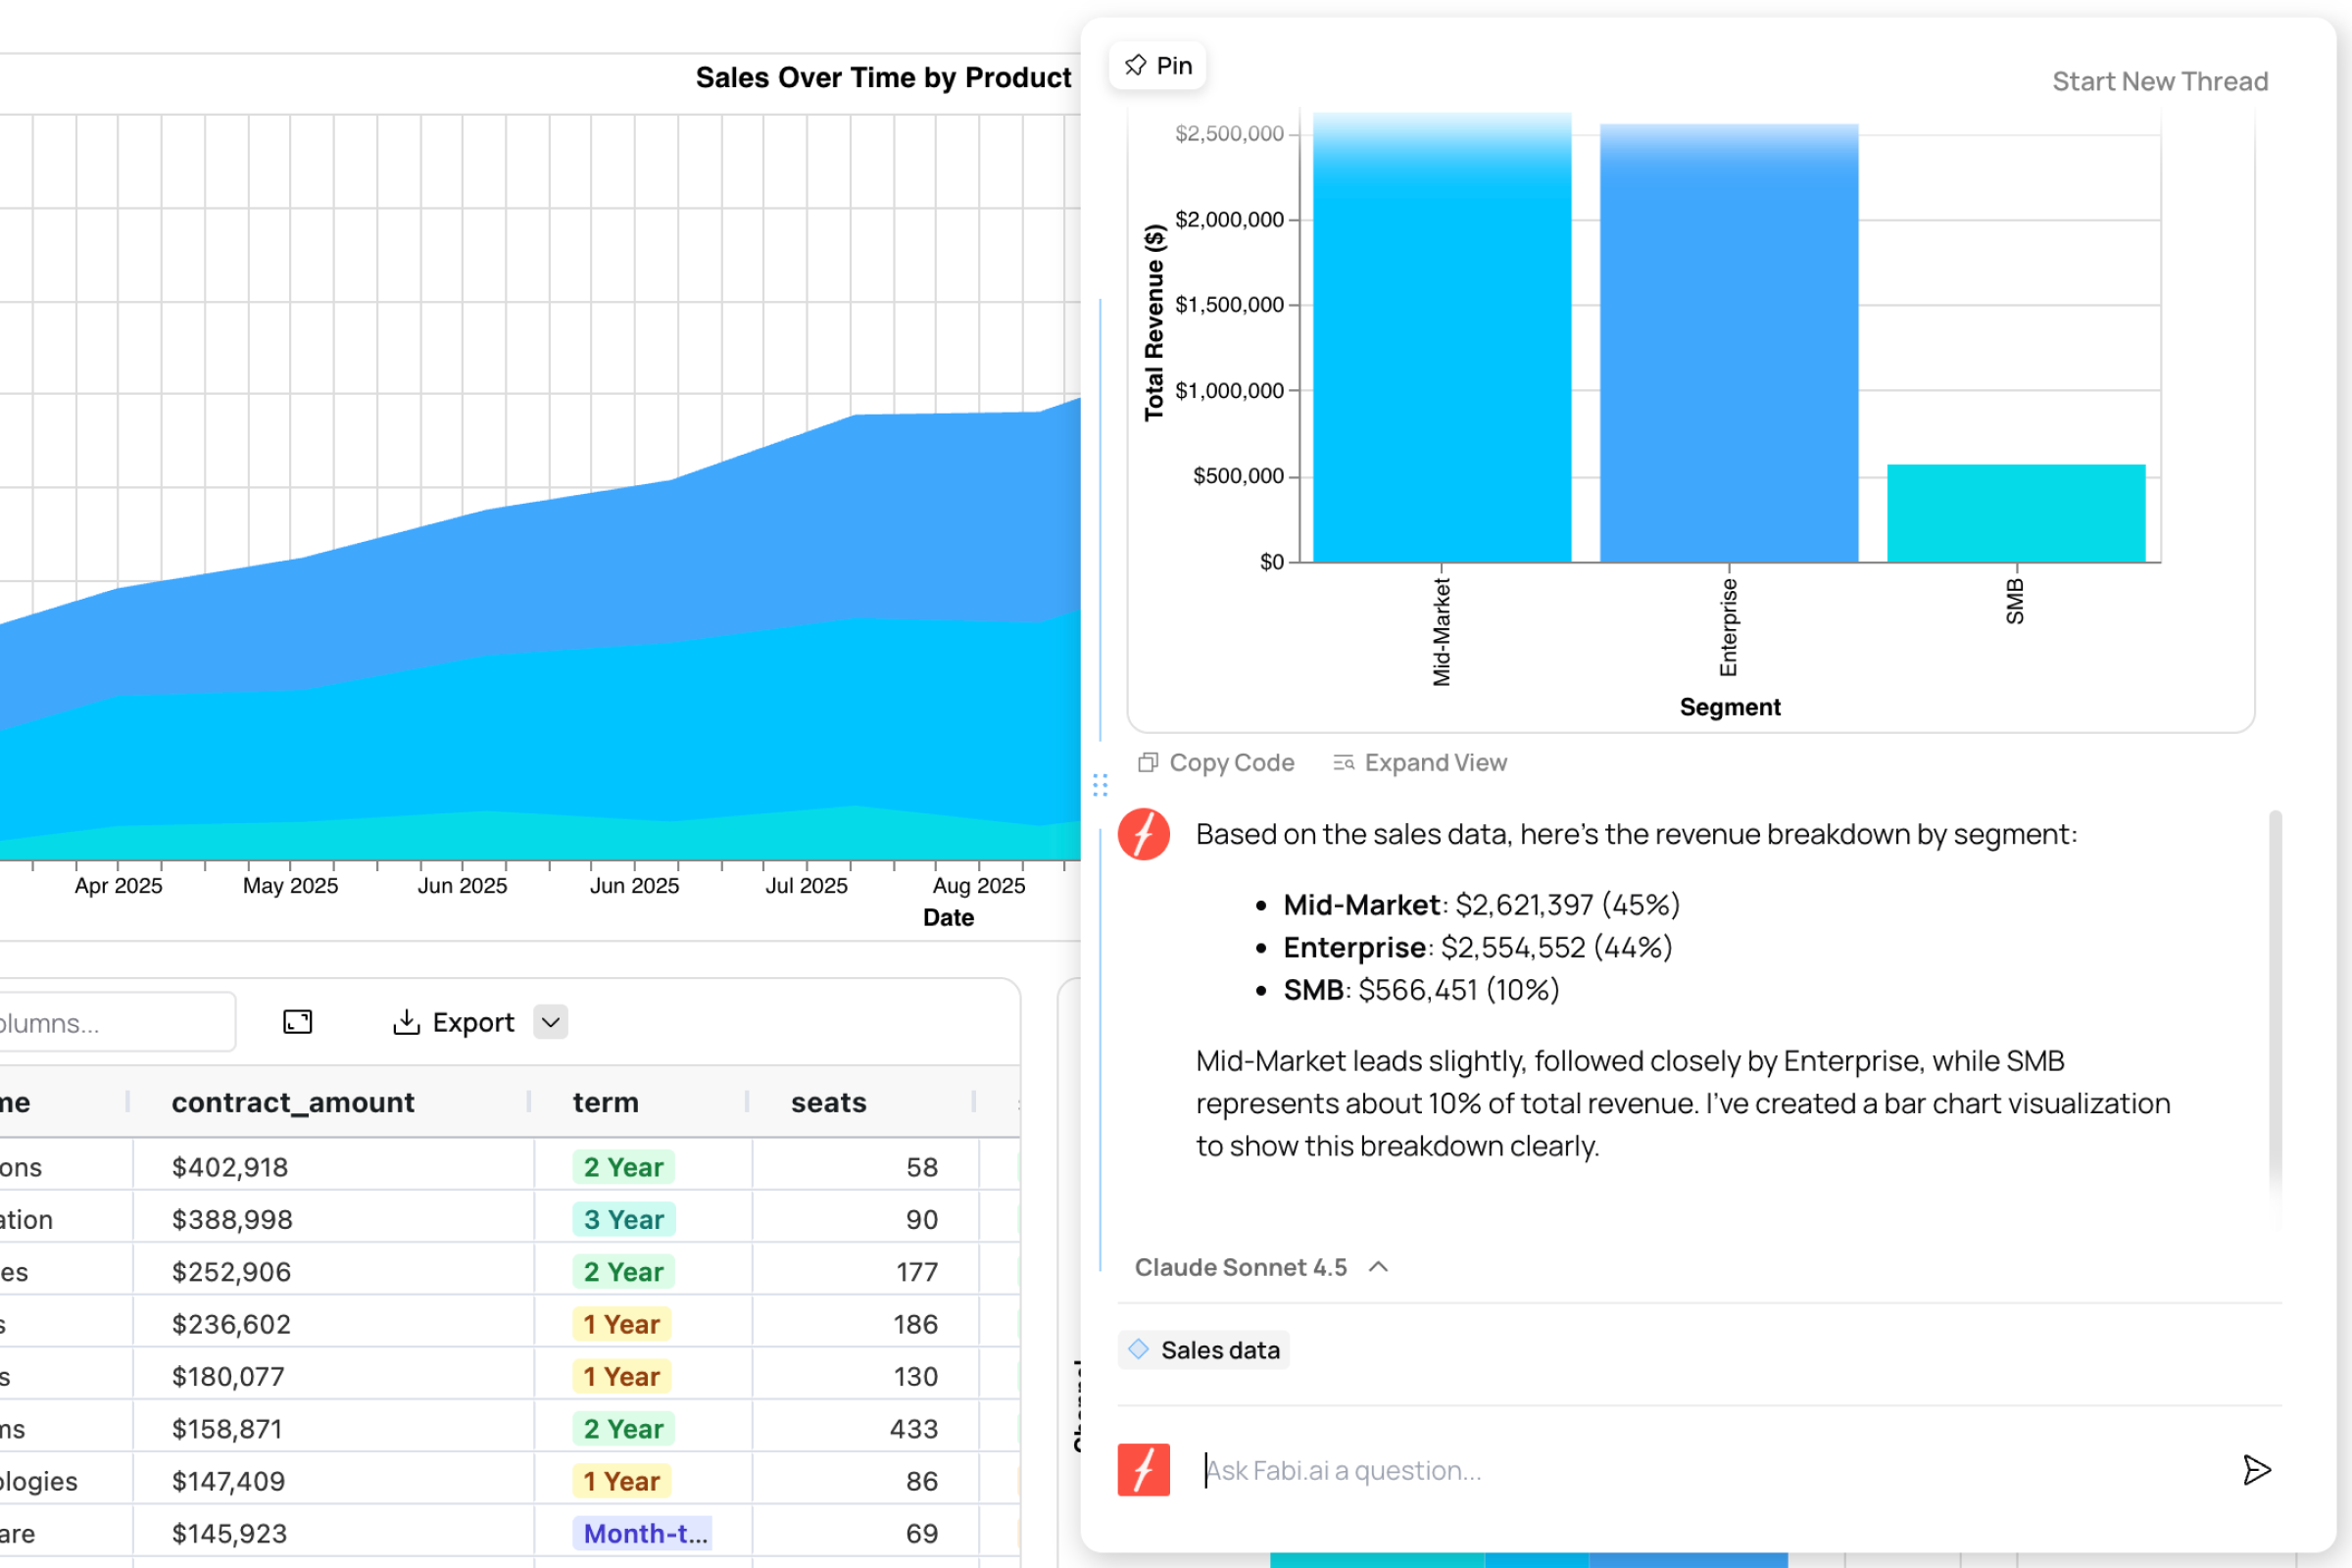
Every dashboard comes with an AI analyst agent automatically embedded to help answer follow-up questions.
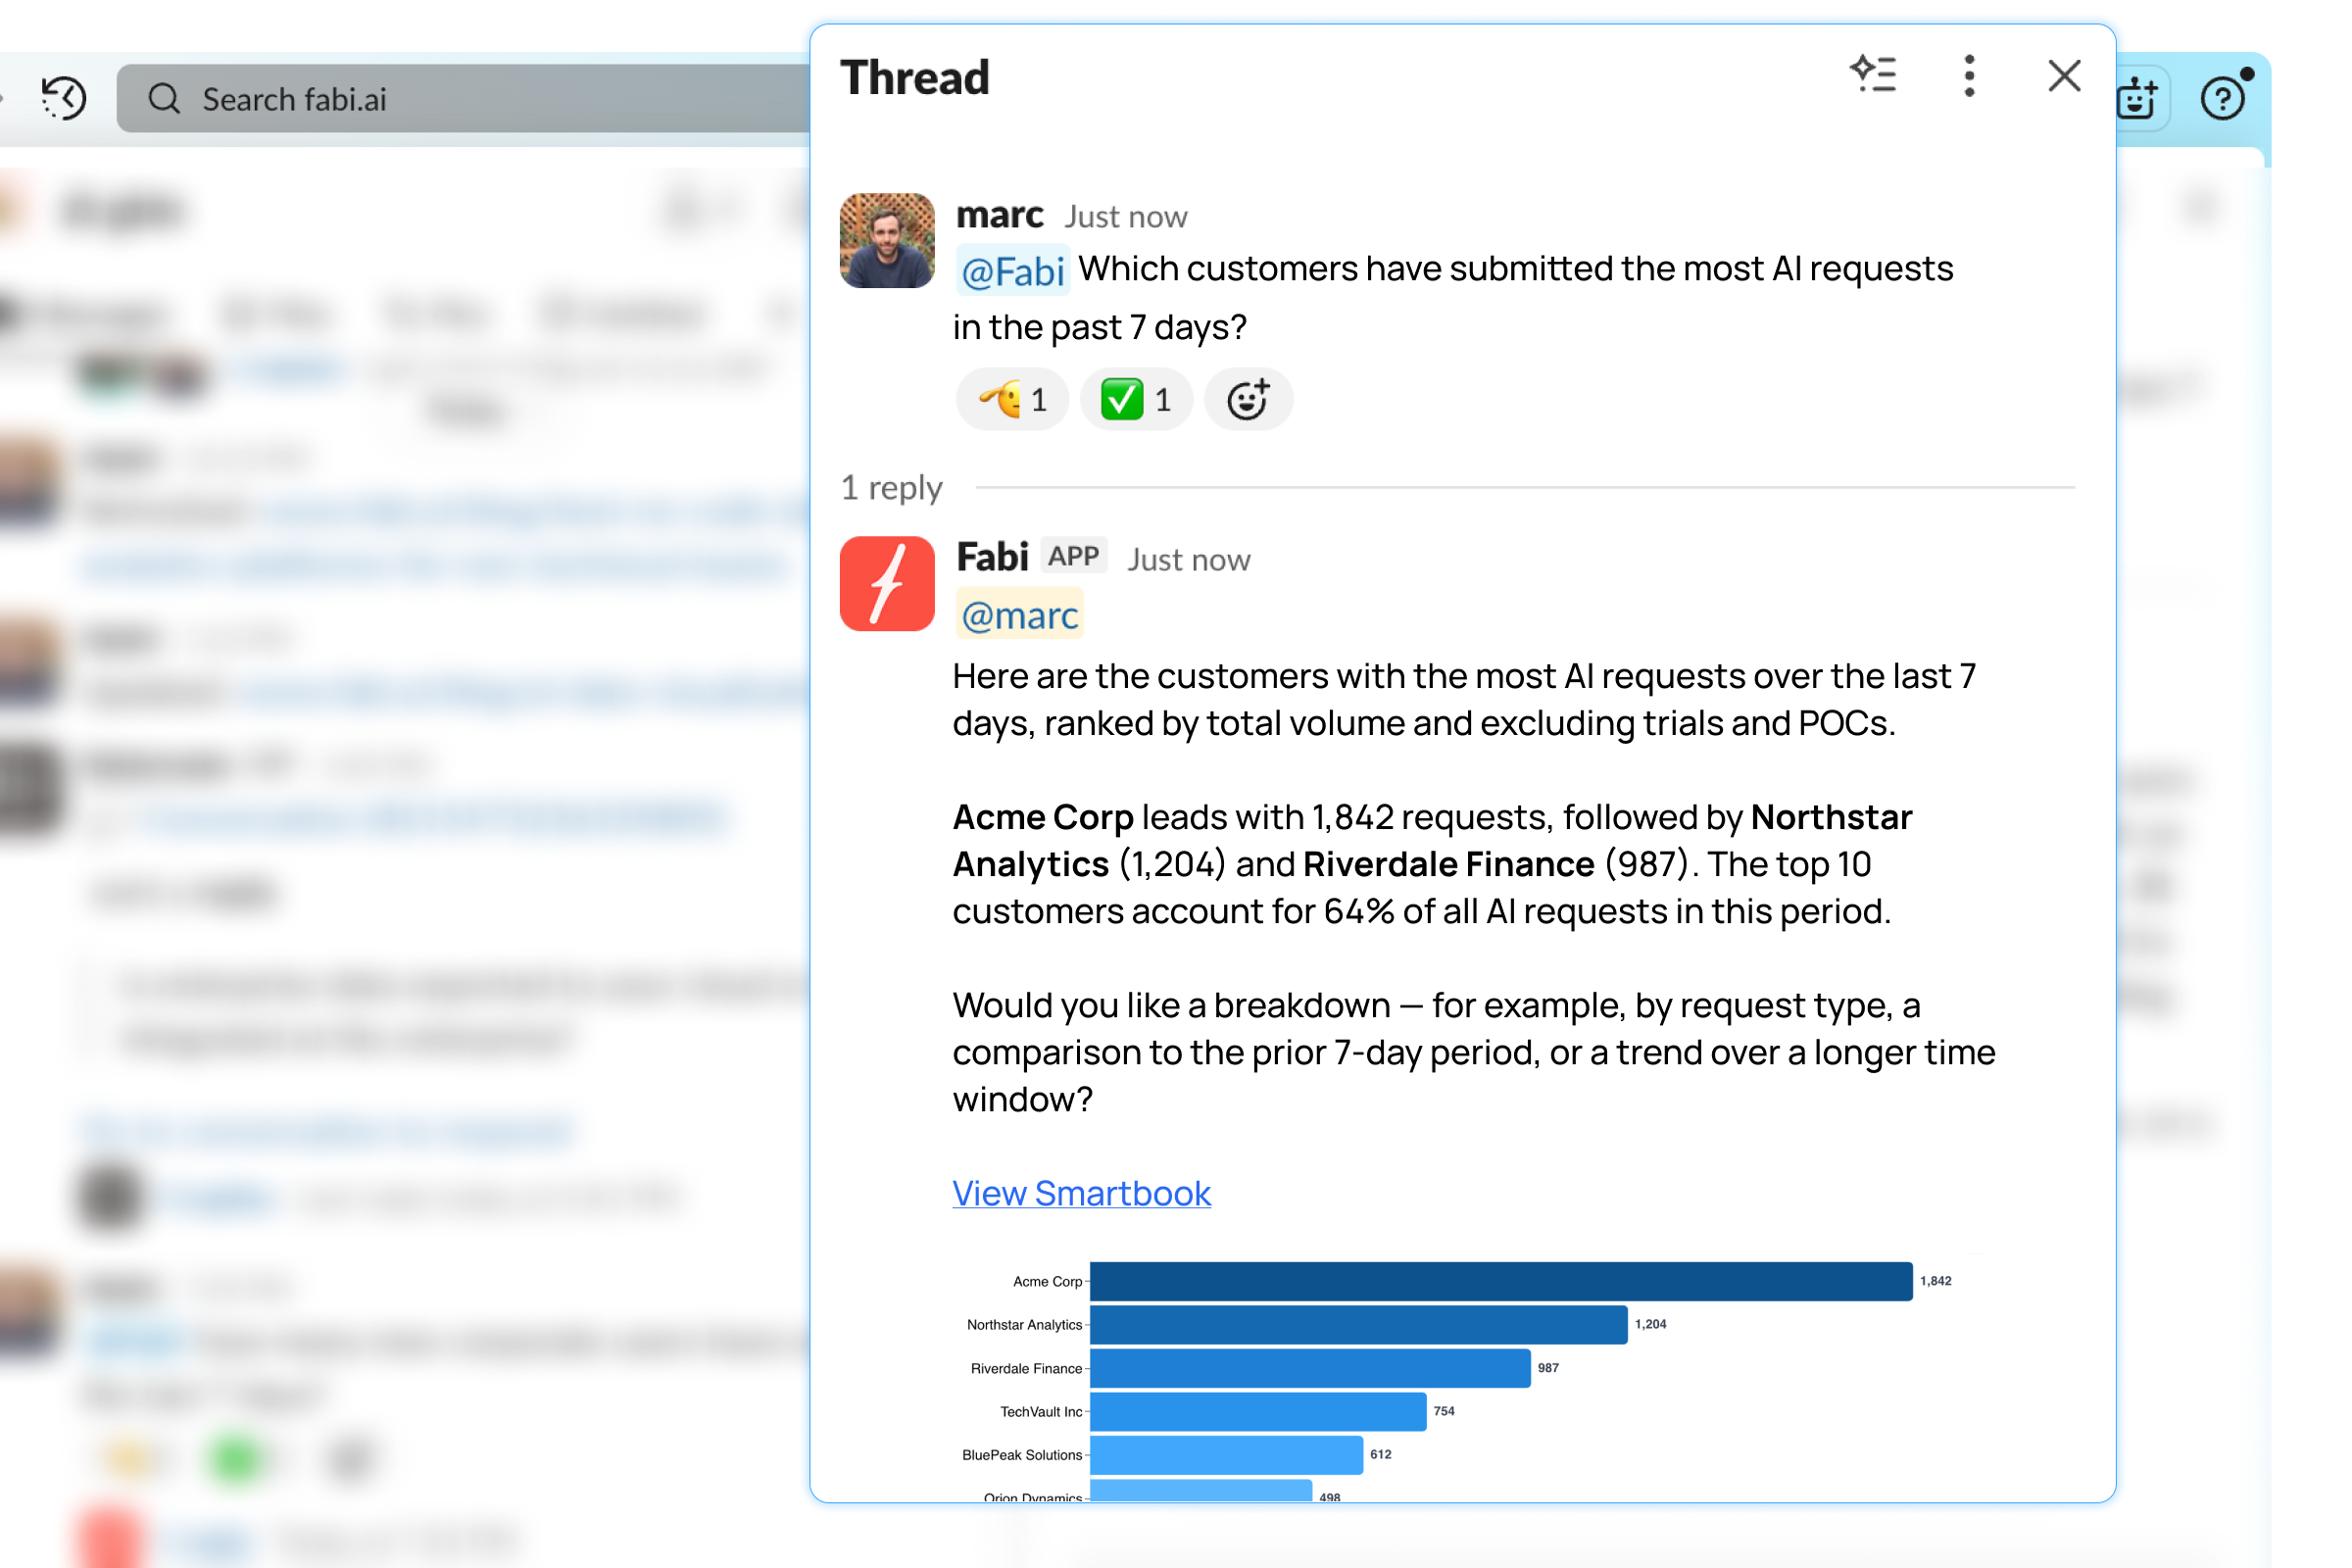
Ask questions of your data right in Slack and get instant answers right where you and your team work.
Generative BI is finally here. Simply tell the Analyst Agent what you want to build and watch it do the work. Jump in and manually make any edits and stay in full control.
Give everyone in your business instant access to a personal data scientists to answer ad hoc questions or simply explore hunches.
The only AI analyst that connects directly to all your business-critical product and GTM data sources.
Stay in complete control at all times. Configure field and table access and provide additional context and semantics as needed or let the AI auto-learn. All in plain English, no PhD in data engineering required.
Every dashboard comes with an AI analyst agent automatically embedded to help answer follow-up questions.
Ask questions of your data right in Slack and get instant answers right where you and your team work.
Features to elevate your reporting game


.png)
Fabi.ai is transforming the way insights are gathered and consumed in the enterprise. Any company not using Fabi.ai is choosing to operate at a disadvantage.

Frequently Asked Questions
Yes, Fabi lets you build AI analytics dashboards using AI, SQL, Python, or a mix of all three. You can ask Analyst Agent to generate the analysis and data visualizations you need, or build them yourself in Smartbooks and then publish as a dashboard. The process is fast: explore your data, create your charts and metrics, then click "Publish Dashboard". Your dashboard automatically refreshes on schedule and stays synced with your latest data.
Fabi's Python dashboards are faster to build (minutes vs weeks), more flexible for advanced analysis and custom visualizations, and fully transparent so you can see and edit the underlying code. Unlike legacy BI tools that lock you into drag-and-drop interfaces and require complex semantic layers, Fabi lets you mix SQL and Python with AI assistance to iterate quickly and handle everything from simple charts to machine learning models in one environment.
Absolutely. Fabi offers extensive customization options. You can adjust colors, fonts, and layouts to align with your brand guidelines. You can also give AI instructions on brand guidelines to ensure consistency.
Yes! Any Smartbook (AI notebook) can be instantly converted into a dashboard with one click. Your analysis, code, and visualizations become an interactive business intelligence dashboard that can be scheduled to run automatically and shared with stakeholders. This seamless transition from analysis to production reporting eliminates the traditional development cycle.
Python dashboards created from your AI notebooks (Smartbooks) can be scheduled to run at regular intervals - hourly, daily, weekly, or custom schedules. Once scheduled, they automatically pull fresh data, run your analysis, and deliver updated insights to your team via email, Slack, or direct dashboard access. Useful for marketing reporting dashboards, sales performance dashboards, weekly pipeline reviews, or any recurring analysis.
Generative BI is the next generation of Business Intelligence. It uses generative AI for data analytics to uncover insights and build dashboards faster than ever.