.svg)


BI platforms: What to look for

TL;DR: Most BI tools fail because 60-80% of dashboards go unused, and analysts spend 78% of their time on busywork rather than insights. The choice between traditional and AI-powered BI depends on your team: traditional works when you have 3+ SQL-fluent analysts. At the same time, conversational BI makes sense when you're pre-data-team or drowning in requests that pull engineering from roadmap work. Companies like Parasail and Aisle achieved 75-92% reductions in analysis time, eliminated 40-50 monthly requests, and delayed analyst hires by 6-12 months (saving $120,000+). What actually predicts success: time-to-first-insight measured in hours, not weeks, non-technical user adoption, and real ROI from analyst hours saved. Most companies see payback in 3-6 months when you calculate the tool cost versus time savings and the delayed-hiring impact.
You’re evaluating BI tools and the pains that brought you here are all too familiar. Siloed data, governance issues, long wait time for data analysis, time-consuming recurring reporting, data privacy concerns, etc. I have heard from data leaders who want to enable non-technical users to self-serve ad hoc data requests to ease the burden on their data teams. I’ve spoken to founders whose priority is whether the tool will scale with their growth without compromising on performance. I’ve demoed for data scientists who want to know how to mitigate the risk of hallucinations by AI.
AI-powered BI is the new buzzword but how is that any better than the incumbents in the space, and how do you evaluate what is right for your organization’s needs? In this blog, I walk through the current state of business intelligence and AI, the criteria for assessing such tools, when traditional BI tools are a good fit, and what makes conversational BI a good candidate for organizations.
Business intelligence and AI represent the shift from traditional BI tools that require SQL expertise to AI-powered conversational BI platforms that anyone can use through natural language. Traditional business intelligence collects and organizes data into dashboards and reports, but accessing insights still requires technical skills. AI changes this by adding natural language processing, automated analysis, and proactive insight generation. Instead of writing SQL queries or waiting for analysts to build reports, teams ask questions in plain English and get immediate answers. This convergence of BI and AI doesn't just make existing workflows faster, it transforms who can access data and how quickly organizations can act on insights.
The cost of wrong BI decisions extends far beyond wasted software spend. Teams get locked into 12-month contracts with tools they never fully adopt. Data request backlogs grow faster than you can hire analysts. At a median analyst salary of $95,000 plus benefits, delayed hires directly impact the runway at early-stage companies.
The data tells a clear story about what's broken. Research from dbtLabs shows that 78% of analysts spend their time on busywork like data prep and tool navigation rather than generating insights. Each analyst loses 9.1 hours per week to inefficiencies, totaling $21,613 in wasted productivity annually. Teams navigate an average of 5.4 different platforms daily, switching between them 5.9 times.
For executives and department heads, these statistics represent a fundamental decision. You need insights to make product and growth decisions, but you can't afford a full data team. The BI tool you choose determines whether data becomes an enabler or a bottleneck. Decision velocity matters more than ever. Companies that move from question to insight in hours rather than days capture opportunities competitors miss.
When Aisle's pilot program evaluations dropped from 2-3 weeks to just a few hours after implementing conversational BI, that speed translated directly into faster product iteration and better market fit.
The term "AI-powered" is used liberally in marketing. Here's how to cut through the claims and identify what actually matters:
Natural language querying (conversational BI) means asking "why did signups drop last week?" in plain English and getting answers. It's not a chatbot that searches pre-built dashboards. Test it by asking follow-up questions. Can the system handle "show me by channel" then "compare to last month" while maintaining context?
Automated insights and anomaly detection mean the platform alerts you when metrics hit thresholds or show unusual patterns. It's not static dashboards with manual threshold alerts. Ask vendors how their systems identify interesting changes from normal noise.
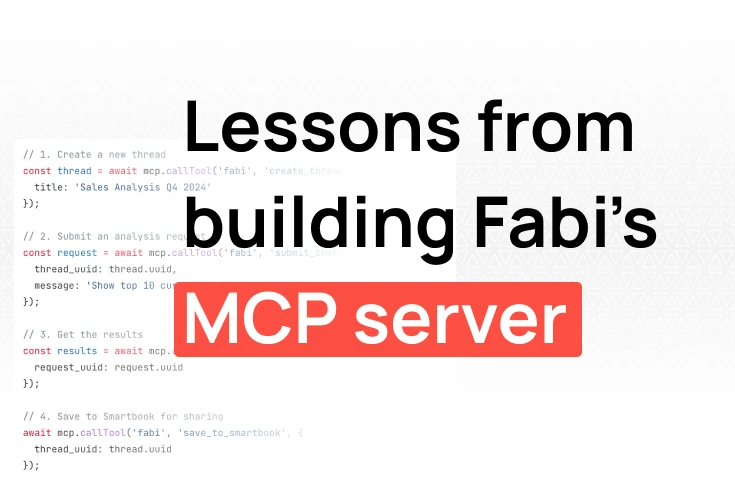
Root cause analysis means the system automatically explores why a metric changed, not just that it changed. It's not drill-down dashboards you manually explore. Test by showing a metric change and asking the system to explain contributing factors. Hologram's customer deep-dives dropped from days to 30 minutes because the platform automatically explored the data.
Automated reporting means scheduled reports are generated and distributed without manual work. It's not email notifications when dashboards update. The test is setting up a weekly report and seeing if it adapts to data changes automatically.
Most startups don't need sophisticated predictive analytics initially. Prioritize descriptive and diagnostic insights first. Focus on platforms that excel at helping you understand what happened and why it happened before worrying about complex forecasting.
This isn't a one-size-fits-all decision. Traditional BI platforms remain appropriate in specific scenarios.
Traditional BI makes sense when:
AI-powered BI typically works better when:
Hybrid approaches work for some organizations. They use traditional BI for core metrics and operational dashboards while adding AI-powered tools for ad hoc analysis and self-service exploration. This reduces analyst backlog while maintaining governed reporting.
The key is being honest about your team's current state and needs. If data requests are overwhelming your technical team and slowing product decisions, that's a clear signal that self-service matters more than customization.
Learning from companies at similar stages provides the clearest picture of realistic outcomes.
Parasail: Startup avoiding data science hires
Parasail operates at the cutting edge of AI infrastructure as a rapidly growing startup expanding from 12 to 20 employees. They needed sophisticated data analytics without diverting resources from their core mission. Traditional BI tools would have taken 2-3 months just to publish their first dashboard.
Instead, they implemented an AI-powered platform and reached productivity in 4-5 hours. Their dashboard creation time dropped 90%, with tasks that would have taken days now taking hours or minutes. Matt from their team highlighted the impact: "Fabi.ai took us four to five hours to learn. A traditional BI tool would probably have taken us a few months to get any sort of dashboard stood up."
The business impact extended beyond speed. They delayed the need for dedicated data science personnel, saving $120,000+ in first-year hiring costs. Board and executive meetings now rely on comprehensive analytics rather than intuition. The data-driven foundation helps them make better decisions about product roadmap, marketing strategy, and resource allocation.
Aisle: Eliminating the request backlog
Aisle's product team was drowning in 5-10 weekly data requests from their brand team. Each request took 30 minutes to 2 hours to fulfill, consuming 15 hours of product and engineering time per week that should have been spent on roadmap priorities.
They trained their non-technical brand team in 15 minutes on conversational BI. The results were immediate: 40-50 monthly requests eliminated, analysis time reduced by 92%, and pilot program evaluations that used to take 2-3 weeks now completed in just a few hours. Within the first month, 100% of brand managers were using the platform for weekly reporting.
Tyler from Aisle's product and customer marketing team explained: "Before Fabi, those insights required looping in our engineering team. Now I can run those analyses myself in minutes." The product team refocused on strategy instead of ad hoc data requests. The time savings compounded into better product decisions and faster market response.
Most BI evaluations focus on the wrong metrics. Feature lists and visualization options matter less than whether your team will actually use the tool. Here's what predicts success:
1. Time-to-first-insight, not time-to-setup
Tools with two-week onboarding processes rarely achieve meaningful adoption. What matters is how long it takes for a non-technical PM to answer a real business question. Modern platforms enable productivity in 4-5 hours, as seen in companies like Parasail. A red flag is when vendor demos only show pre-built dashboards, never live querying.
2. Non-technical user adoption, not feature lists
Your brand manager and operations lead need insights, not just your data team. The benchmark is simple: can someone without SQL training use this independently? At Aisle, 15-minute training enabled self-service for their brand team. Watch for vendors who say "your data team will love this," but don't mention other teams.
3. Request backlog elimination, not dashboard count
High volumes of data requests pull engineering and product teams away from roadmap work. How many weekly requests to your data team could be self-served with the new platform? According to Aisle's results, eliminating 40-50 monthly requests is typical. A red flag is tools that still require data team involvement for every new question.
4. Decision velocity improvement, not query speed
Fast database queries mean nothing if insights still take days to surface. What matters is the time from "we need to understand X" to "here's what we should do." Companies like Aisle compressed multi-week analyses to 3 days or hours. Red flag: vendors focus on database performance, not end-to-end workflow time.
5. Real ROI vs tool cost, not per-seat pricing alone
The actual cost includes analyst time, delayed hires, and the opportunity cost of slow decisions. Calculate analyst hours saved multiplied by hourly rate, then subtract the platform cost. A single analyst's salary saved at $95,000 plus benefits typically pays for the platform 5-10 times over. The ROI calculation becomes straightforward when you measure actual capacity gained.
The honest reality about BI ROI
Here's what you need to know: research shows 60-80% of BI dashboards go unused despite massive investments. The problem is rarely the tool itself. It's that companies build dashboards for data rather than for people.
Calculate ROI in three components that actually matter:
Realistic timeline expectations:
Organizations typically see a 15-25% reduction in reporting-related expenses within the first year. That's the realistic baseline, not the 10X transformation some vendors promise.
Better questions during vendor evaluations reveal which platforms will actually work for your team.
On accessibility:
On real-world performance:
On implementation:
On business impact:
Red flags to watch for:
A structured decision framework helps cut through vendor noise and focus on what matters for your specific situation.
Step 1: Quantify your current state
Step 2: Define success metrics
Step 3: Run a focused evaluation
Step 4: Calculate realistic ROI
Step 5: Plan adoption, not just implementation
Use this template for your decision: "If we can eliminate X hours weekly of data requests and enable Y people to self-serve insights, this pays for itself in Z months."
For most early-stage companies, breakeven occurs within 3-6 months when you account for the actual analyst time saved and the delayed hiring needs.
The question isn't whether AI changes BI anymore. It's whether your team is set up to take advantage of it. The companies seeing 75-92% time reductions aren't doing anything magical. They picked tools where non-technical people could actually become self-sufficient, where asking questions didn't require SQL knowledge, and where the analyst team stopped being a bottleneck for every data question.
Not everyone needs to rip out their existing BI stack tomorrow. If you've got a strong data team and most of your business users are comfortable writing SQL, incremental improvements might be enough. But if you're pre-data-team, drowning in Slack requests, or watching competitors ship faster because they're not waiting on dashboards, the tools exist to fix that.
The results from companies like Parasail and Aisle aren't outliers. They're what happens when you choose platforms built for self-service from the start, not traditional BI tools with AI features tacked on.
When you're evaluating tools, the questions that matter have changed. How long until a PM can answer their own questions? How many Slack pings does your data team field per week? How fast can someone go from curiosity to insight? Those metrics tell you more than any feature list.
See how AI-powered analytics eliminates data bottlenecks. Explore Fabi's conversational BI platform today.