.svg)


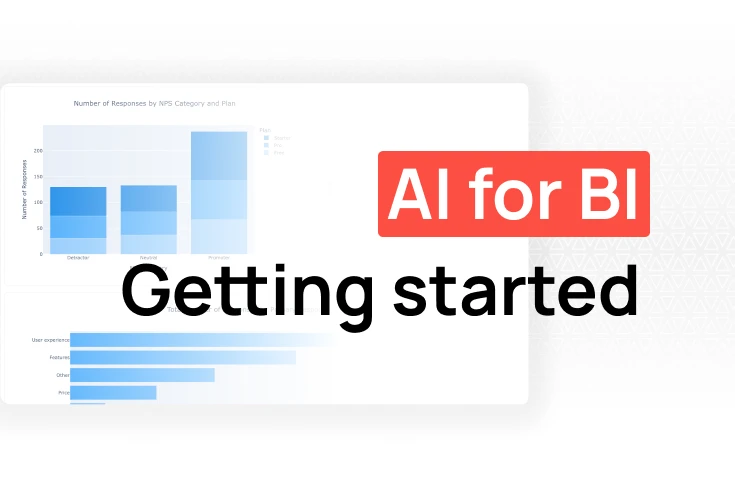
AI for BI: How to get started and find insights to grow your business

Early-stage startups need data visibility but can't afford dedicated data teams or spend weeks building dashboards in traditional BI tools. AI dashboards solve this by using natural language queries to generate SQL and Python automatically, letting teams build dashboards in 10-15 minutes instead of hours. That's why customers like Aisle achieved 92% faster analysis while eliminating 40-50 monthly requests. Fabi.ai combines universal data connectivity, an AI Analyst Agent for natural language queries, and automated workflows that push insights to Slack and email—all with a 15-minute learning curve versus months for traditional BI tools.
Your product team just launched a new feature yesterday. Your CEO wants to know if it's working. Your marketing team needs to understand which channels are driving the best users. Your finance team is asking about revenue impact.
Everyone's asking you for answers. The problem? Your data lives in seven different tools, and pulling it together means hours of manual work in Google Sheets. By the time you've built the analysis, the questions have changed.
This is the reality for early-stage startups and small teams. You need real-time visibility into key metrics to move fast and make informed decisions. Traditional business intelligence workflows require large data teams that most startups can't afford. The pricing adds another barrier, with enterprise licenses costing thousands monthly before you even connect your data sources.
You've tried the obvious workarounds. Built-in reporting from your tools works fine when you're looking at one metric in isolation. But the moment you need to connect the dots across product usage, marketing spend, and revenue, you're back in spreadsheets. The analysis is hacky, time-consuming, and breaks the moment your data volume grows.
The gap between questions and answers kills momentum. Your team is experimenting daily with product features and go-to-market strategies. They need insights immediately, not after submitting tickets to an overloaded data queue.
The solution isn't adding headcount to data teams or spending months learning complex BI tools. AI dashboards enable small, lean teams to answer their own questions without overloading the few technical people you have.
Traditional Business Intelligence (BI) dashboards provide visual representations of key metrics and data patterns. They're designed to answer recurring business questions at a glance. Historically, building these dashboards required two distinct teams: data engineers and analysts who build the dashboards, and business stakeholders who consume their insights.
The problem starts with the technical expertise required. Building dashboards demands SQL proficiency, data modeling skills, and data visualization design knowledge. Many teams end up exporting datasets to Excel for manual data analysis because BI tools lack flexibility.
Development cycles stretch from days to weeks for each dashboard in traditional BI tools like Tableau, Power BI, or Looker. The real cost isn't just time-to-build, it's time-to-insight. Teams wait for answers while opportunities pass them by.
Dashboard graveyards fill up with beautiful visualizations that nobody uses. These static reports disconnect from daily workflows and become outdated as business needs evolve.
For startups, this problem compounds because you can't afford large, dedicated data teams early on. The common solution, pulling data manually from seven different tools into spreadsheets, is a clumsy solution that burns hours of your time every week. Hours that you know you can’t afford to burn.
You need to iterate based on daily product and market experiments. Cross-functional visibility becomes critical when everyone wears multiple hats.
AI dashboards represent a novel category that combines three essential elements:
These AI-powered analytics tools solve the traditional builder-consumer divide across multiple use cases. Non-technical team members create their own interactive dashboards using natural language queries and pre-built templates. Technical leaders prototype in minutes instead of days, tracking KPIs without writing code.
The end result? Everyone gets self-service analytics without SQL expertise or a learning curve measured in months.
The business impact shows up immediately in faster decision-making. Insights become available when needed, not weeks later through a data team queue. Team empowerment increases as business users answer their own questions without bottlenecks. Resource efficiency improves because product and engineering teams focus on building features, not generating reports.
Real-world evidence demonstrates these benefits at scale. One of our customers, Aisle, now builds dashboards in 10 to 15 minutes versus an hour or more manually, achieving 92 percent faster analysis. When small teams get self-service capabilities, they can eliminate 40 to 50 monthly ad hoc requests that previously consumed data team bandwidth.
The time investment required to build dashboards compounds across teams. Developing a quality report might require 20 hours initially. That time investment may be paid back later through repeated use. However, for early-stage startups, those 20 hours represent a significant barrier when you're testing hypotheses daily.
AI changes this calculus completely. Teams go from natural language questions to working dashboards in minutes. No SQL required means describing what you want to see generates the queries automatically. Instant iteration lets you refine questions, adjust visualizations, and explore hypotheses in real-time.
The value equation changes when dashboards become this accessible. High-frequency usage of daily operations dashboards creates massive time savings. Executive dashboards used monthly still provide critical decision support. Meanwhile, unused dashboards become obvious quickly and get retired without guilt or wasted development investment.
The paradigm shifts fundamentally with AI-powered analytics. Traditional models separate data analysts who build from business stakeholders who consume. AI dashboard models let anyone build while everyone consumes insights where they work.
Builder profiles expand dramatically in this new world:
Real adoption patterns prove this accessibility. Parasail expanded analytics from one to two technical users to their entire team. Non-technical users achieve results faster than with Microsoft Power BI or Tableau, which require months of training.
Consumption happens everywhere teams work. Dashboards push to Slack, email, and Google Sheets automatically. Insights arrive where teams spend their time, not in separate tools requiring memory and context switching. This workflow integration delivers on the promise of intelligence without heavy maintenance costs.
Startups need unified visibility across sales, marketing, and operations data. Information lives everywhere: HubSpot for CRM, Google Analytics for web traffic, Salesforce for sales pipelines, Shopify for commerce data, and production databases tracking application usage.
Traditional approaches required building ETL pipelines and maintaining data warehouses before generating any insights. Application connectors eliminate this complexity by connecting directly to business tools through API integrations. This provides intelligence without heavy maintenance and cost overhead.
AI dashboards can also connect to existing databases and data warehouses that contain internal, proprietary data. SQL database connections support Snowflake, Databricks, BigQuery, Postgres, and other popular data sources.
This lightweight alternative matches startup reality. Building traditional stacks with BI tools, data warehouses, and ETL pipelines feels heavy for small teams. AI dashboards provide business intelligence functionality without dedicated data engineering resources.
Fabi.ai combines every element startups need in one unified AI-powered analytics platform:
Above all, Fabi.ai is built for collaboration. Non-technical team members create their own dashboards using natural language queries. Data teams build advanced analyses with full coding capabilities. Everyone works in the same environment without tool fragmentation.
AI dashboards eliminate the analyst backlog that slows early-stage startups. Instead of hiring multiple analysts to handle ad-hoc requests, small teams can answer their own questions while technical resources focus on strategic analysis and data infrastructure. Teams get enterprise-grade analytics without enterprise resources or complex technical skills. Self-service insights mean moving faster when competitive advantage depends on speed. The transformation extends beyond time savings into fundamentally different decision-making capabilities.
Fast-moving startups need real-time visibility into what's working and what needs adjustment. AI enables experimentation at the speed of modern product development. Finally, data-driven decisions can happen without waiting for data teams to clear their backlogs. Analytics also becomes accessible to everyone, not just technical specialists familiar with open-source tools or complex BI platforms.
The value isn't just time saved through automated workflows. It's decisions made faster using actionable insights, experiments run more confidently with real-time data, and opportunities captured because insights arrived when they mattered.
Get started with Fabi.ai for free in less than five minutes. Build your first AI dashboard and see the difference between traditional BI tools and AI-driven analytics platforms designed for startups.