
.svg)


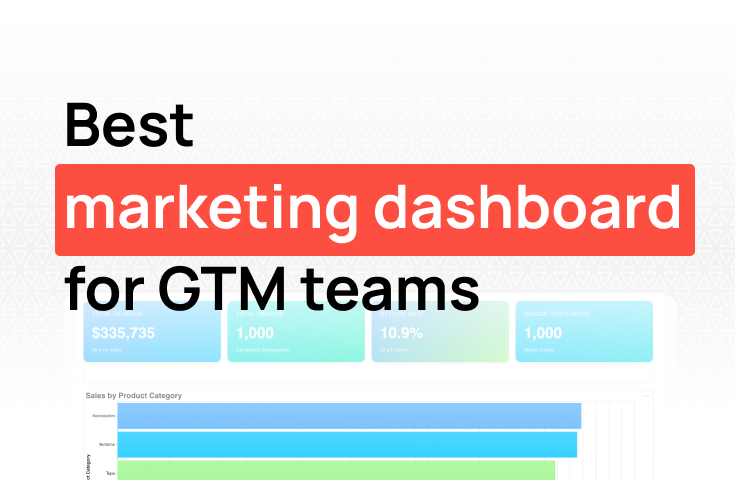
Top 5 marketing dashboard solutions for marketing and GTM teams
TL;DR: A sales dashboard gives your team real-time visibility into pipeline health, deal velocity, rep performance, and revenue. Most sales teams rely on CRM-native reports, which are slow to build and limited to CRM data. A good sales dashboard pulls from your CRM, billing system, and other sources to show the full picture — not just deals in progress, but how they convert to actual revenue. Fabi.ai lets you build sales dashboards by connecting your data sources and asking questions in plain English — no SQL or report builder required.
Every sales team has a CRM. And every sales team has the same complaint about it: getting a clear picture of pipeline health requires running three reports, exporting to a spreadsheet, and spending 30 minutes formatting the results into something you can actually present.
CRMs are built to manage deals. They track contacts, log activities, move opportunities through stages. They're good at this. But the moment you need to answer a question the CRM didn't anticipate — "which lead source produces the fastest-closing deals?" or "how does our win rate compare when a prospect uses the free trial vs. when they don't?" — you're either stuck in a rigid report builder or exporting data to figure it out manually.
A sales dashboard solves this by pulling together pipeline, activity, and revenue data into a single view that updates automatically. When it's built well, your weekly pipeline review takes five minutes instead of an hour of report-building.
Here's how to build one.
A sales dashboard is a real-time view of your sales team's performance, pipeline, and revenue metrics. It pulls data from your CRM, and ideally from your billing system and other sources, into a single interface that your team can check at a glance.
The purpose isn't to replace your CRM. It's to surface the metrics that tell you whether your sales motion is working — without requiring anyone to build custom reports or exports.
A sales dashboard answers questions like:
Sales dashboard vs. CRM reports: Your CRM has built-in reporting. The difference is scope and speed. CRM reports are limited to CRM data and often require manual configuration for each question. A sales dashboard combines data from multiple sources, updates automatically, and is designed to be scanned in seconds rather than built from scratch each time.
Different roles need different views. A VP of sales looking at quarterly targets needs different metrics than a sales manager coaching reps on daily activity. But there's a core set that most sales dashboards should include.
What to leave off: individual email open rates, total number of contacts in the CRM, deal count without dollar values, and anything that measures effort without connecting it to outcomes.
A single sales dashboard for everyone is a common mistake. The VP of sales needs quarterly revenue trends and forecast accuracy. The sales manager needs rep-level activity and deal progression. The rep needs their own pipeline and next actions.
Decide on the primary audience first. You can build multiple views later, but starting with a clear user in mind keeps the dashboard focused.
For most small sales teams, start with the manager view: pipeline health, deal velocity, and rep performance. This covers the metrics that drive the most frequent decisions (which deals to push, which reps to coach, whether pipeline generation is on pace).
Sales data is less fragmented than marketing data, but it still spans multiple systems:
Identify which source holds each metric you defined. The metrics that span multiple sources — like revenue by lead source (CRM + billing) or win rate by product usage (CRM + product database) — are the most valuable and the hardest to get from a single tool.
CRM-native dashboards (Salesforce, HubSpot)The path of least resistance. If your data lives in Salesforce or HubSpot, their built-in report builders can cover basic pipeline and activity dashboards. No integration needed. The trade-off: you're limited to CRM data. Revenue that doesn't match CRM records (invoicing discrepancies, usage-based billing, multi-product deals) won't appear. Custom metrics beyond what the report builder supports require admin-level configuration or an add-on.
Traditional BI tools (Looker, Tableau, Power BI)Maximum flexibility. You can model data however you want, combine any source, and build exactly the dashboard you need. The cost: setup takes weeks, requires SQL knowledge, and someone needs to maintain the data pipelines. If you have a RevOps or data team, this works. If you don't, it's overkill.
AI-native analytics (Fabi)This is the approach we built Fabi around. Connect your CRM, billing system, product database, and 100+ other sources. Then ask questions in plain English:
"What's our win rate by lead source this quarter?"
"Which reps have the shortest average sales cycle?"
"Show me deals that have been in the proposal stage for more than 14 days."
"How does trial usage in the first week correlate with close rate?"
You get a sales dashboard that updates automatically, plus the ability to investigate any number on the spot. When the VP asks "why did win rate drop this month," you ask a follow-up question instead of building a new report.
Connect each data source you mapped in Step 2. Then check the numbers against your CRM and billing system.
Pipeline value should match your CRM. Closed revenue should match your billing system (not your CRM — the billing system is the source of truth for what was actually collected). If there's a gap, investigate before building on top of incorrect data.
Common issues to watch for:
Sales dashboards are scanned during pipeline reviews and standups. They need to communicate pipeline health in seconds.
Layout principles:
A sales dashboard should be a fixture in your team's routine, not a tool someone opens once a quarter.
Tracking activity without outcomes. A dashboard that shows 200 calls this week feels productive. But if none of those calls turned into meetings, the activity metric is hiding a problem. Always pair activity metrics with conversion metrics.
Using CRM data as revenue truth. CRM "closed won" amounts and actual collected revenue rarely match perfectly. Prorations, discounts applied at invoicing, multi-year deals recognized differently — there are many reasons for gaps. Use your billing system for revenue metrics and your CRM for pipeline and activity.
One dashboard for every role. A VP doesn't need to see individual rep call counts. A rep doesn't need quarterly revenue trends. Trying to serve everyone with one view means nobody gets what they need. Build role-specific views: leadership, manager, and rep.
Ignoring pipeline quality. $2M in pipeline sounds great until you realize half of it is 6-month-old deals that haven't responded in weeks. Add aging and last-activity-date filters to distinguish real pipeline from wishful thinking.
Not connecting to product data. For product-led sales motions, the most predictive signals often come from product usage, not CRM activity. A prospect who spent three hours in your product this week is more likely to close than one who hasn't logged in since the demo. If your sales dashboard can't see product data, you're missing these signals.
Setting it up once and never revisiting. Sales processes evolve. Stages get renamed, new lead sources appear, territories change, reps join and leave. If nobody updates the dashboard to reflect these changes, the data drifts and trust erodes.
Most sales teams have more data than they can use. The CRM captures every call, every email, every stage change, every deal. The problem isn't data collection — it's that turning that data into a clear picture of pipeline health, team performance, and revenue trajectory requires too much manual work.
A sales dashboard eliminates the gap between raw CRM data and the answers your team needs. Pipeline vs. target, at a glance. Deal velocity, by segment. Rep performance, with context. And when something looks off, the ability to investigate immediately instead of spending an hour in a report builder.
Start with the five metrics your team talks about every week. Connect your CRM and billing data so the numbers stay current. And pick a tool that lets you go deeper when the numbers raise questions.
Try Fabi free — connect your CRM and billing data and build your first sales dashboard in minutes, not weeks.


.webp)