.svg)


Turn your small business data into decisions with the right dashboard solution that fits your small business needs.

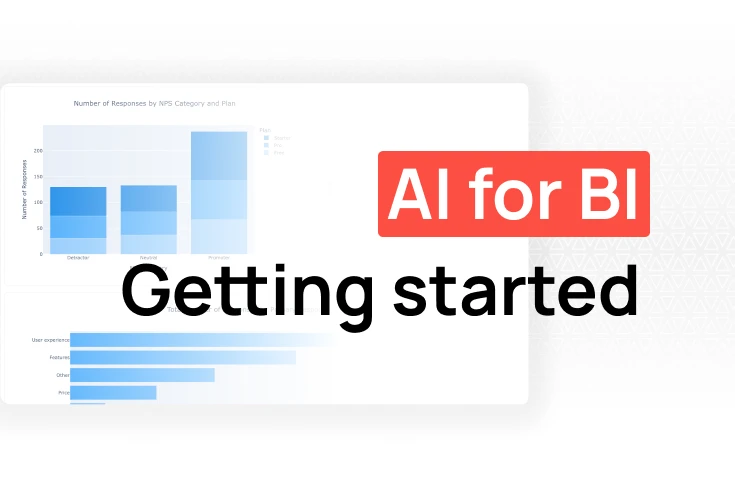
TL;DR: Fabi transforms your Google Sheets into professional, AI-powered dashboards without requiring any coding knowledge. Connect your sheets in seconds, use natural language to build charts and metrics, then publish shareable dashboards that auto-refresh on your schedule. The best part? Your team gets an embedded AI analyst that can answer follow-up questions directly in the dashboard.
Google Sheets is where a lot of business data lives -- sales figures, campaign performance, operational metrics, budget tracking. The question is what to do with it when you need to present it, monitor it, or share it with people who aren't going to scroll through a spreadsheet.
You have a few options:
- Build charts and pivot tables directly in Google Sheets
- Connect Google Sheets to a dedicated visualization tool (Looker Studio, Fabi)
- Export data into a full BI platform (Tableau, Power BI)
Each approach fits different situations. Here's a quick comparison:
Native Google Sheets charts make sense when:
- Your data is in one sheet and stays simple
- You need a quick chart for your own reference or a one-off presentation
- You don't need the view to update automatically
A dedicated tool makes more sense when:
- You need the dashboard to refresh automatically when the source sheet changes
- Multiple people need to view it without access to the underlying spreadsheet
- You want interactivity: filters, drill-downs, follow-up questions
- You're pulling from multiple sheets or sources
- The chart types built into Google Sheets don't cover what you need
If you're in the second list, the rest of this guide walks through how to build it with Fabi.
We have a pre-built Google Sheets dashboard template in our template gallery if you want a starting point. Or follow the steps below to build from scratch.
If you are a visual learner here is a quick video guide of how to do this:

The setup is refreshingly simple. Here's what you need to do:
Head over to Fabi and sign up for free. No credit card required, no complicated onboarding, just create an account and you're in.
Once you're logged into Fabi, you'll land in what's called a "Smartbook," think of this as your data analysis workspace. On the right side, you'll see the AI assistant ready to help.
To connect your sheet, you have a few options:
If this is your first time connecting Google to Fabi, you'll authenticate your account (standard OAuth security). After that, you'll see all your available sheets and can select which ones to import.
Pro tip: You can import a single sheet or multiple sheets from the same spreadsheet. Fabi treats each as a data source you can query and visualize.

Select the sheet(s) you want to work with and hit Run. Behind the scenes, Fabi converts your sheet into a Python dataframe (essentially a table). Once imported, the AI performs an initial exploratory analysis automatically, giving you a head start on understanding your data structure and key metrics.
Instead of configuring chart settings manually, describe what you want:
- "Show me total sales by product category"
- "Create a stacked bar chart sorted by revenue"
- "What are my top 10 customers by order volume?"
Fabi generates the chart. Keep iterating if you want adjustments: "Sort this by total sales" or "Switch this to a line chart." When it looks right, click "Pin to Smartbook" to save it to your workspace.
Continue for each metric you need:
- "Show me total revenue over time with a trend line"
- "What products have the highest refund rate?"
- "Break down conversions by traffic source this month"
Each becomes a separate block in your Smartbook. You can rename blocks and add text notes to give viewers context.
Before you start, click "AI Settings" to give the assistant your role, brand colors, and default chart preferences. Every chart it generates will match your standards without manual formatting.
.webp)
Click "Schedule and Publish" to enter layout mode. Drag and resize elements to create your layout, add titles and notes, and remove anything used during analysis that you don't want in the final view. Organize logically -- key metrics at the top, trends in the middle, details at the bottom.
Set your refresh schedule: hourly, daily, or weekly. Your Google Sheet stays as the source of truth -- your team keeps updating it as usual, and the dashboard updates automatically.
Click "Finish and View Report" when ready. Share via email invite with anyone who needs access.
Every published Fabi dashboard includes an embedded AI analyst. Anyone viewing the dashboard can ask follow-up questions without editing the main view:
- "Why did sales spike in March?"
- "What's driving the refund rate in electronics?"
- "Show me this broken down by customer segment"
Different stakeholders can explore their own questions without the dashboard author having to rebuild anything.
The metrics that matter depend on who's looking. Here are starting points for three common teams, all buildable from Google Sheets data using Fabi.
A marketing dashboard from Google Sheets typically covers:
- Campaign performance: spend, impressions, clicks, conversions by channel
- Lead volume and quality: MQLs by source, lead-to-opportunity rate
- Pipeline contribution: marketing-sourced pipeline, stage progression
- Content and web: traffic by source, conversion rate by page, top-performing assets
Useful starting prompts:
- "Show me conversions by channel for the last 90 days"
- "Which campaigns have the best cost per lead?"
- "Compare this month's lead volume to last month by source"
A small business dashboard from Google Sheets usually tracks:
- Revenue: monthly totals, growth rate, top customers by spend
- Operations: order volume, fulfillment time, inventory levels
- Expenses: actual vs. budget by category, burn rate
- Customers: new vs. returning, average order value, churn indicators
Useful starting prompts:
- "Show me monthly revenue with a trend line for the last 12 months"
- "What percentage of revenue comes from repeat customers?"
- "Which expense categories are over budget this quarter?"
A RevOps dashboard from Google Sheets typically covers:
- Pipeline: open deals by stage, deal velocity, win rate by rep
- Sales activity: calls, emails, meetings logged per week
- Forecasting: projected close vs. quota, coverage ratio
- CRM hygiene: deals missing required fields, opportunities not updated in 14+ days
Useful starting prompts:
- "Show me pipeline by stage and rep"
- "What's the average time deals spend in each stage?"
- "Which reps are ahead of quota this month?"
Can I build a dashboard directly in Google Sheets?
Yes. Google Sheets has built-in chart tools, pivot tables, and a template gallery. They work well for simple, single-sheet use cases. The limitations appear when you need automatic refresh, multiple data sources, interactivity beyond basic filtering, or more polished output than native Google charts can produce. For a view only you need, native Sheets is fine. For something you'll share with stakeholders or update regularly, a dedicated tool gives you significantly more control.
What is a Google Sheets dashboard template?
A Google Sheets dashboard template is a pre-built spreadsheet structure with charts, pivot tables, and formatting set up for a specific use case -- sales tracking, marketing performance, budget monitoring, and so on. You populate it with your own data and the charts update. We have a [Google Sheets dashboard template](https://www.fabi.ai/template-gallery/google-sheets-dashboard) that works differently: it connects your existing sheet to Fabi and builds the dashboard from your actual data using AI, rather than asking you to fit your data into a fixed layout.
How do I make a Google Sheets dashboard update automatically?
Inside Google Sheets, there's no native auto-refresh -- you have to update the data manually or use Google Apps Script. Tools like Fabi and Looker Studio maintain a live connection to your Google Sheet, so the dashboard refreshes automatically when the sheet changes. In Fabi, you set the refresh frequency (hourly, daily, or weekly) in the scheduling settings.
What's the difference between Looker Studio and Fabi for Google Sheets dashboards?
Looker Studio connects to Google Sheets and builds visualizations through a drag-and-drop report editor. It's free and works well for straightforward charts and standard Google Workspace workflows. Fabi uses a conversational AI interface -- you describe what you want in plain English and the AI generates the visualization. Fabi also includes an embedded AI analyst in every published dashboard, so viewers can ask follow-up questions on demand without the dashboard author having to rebuild anything. Looker Studio is the right call if you're fully within the Google ecosystem and need something free; Fabi is faster to build with and more interactive in use.
Do I need SQL or coding knowledge to build a dashboard from Google Sheets?
Not with Fabi. You connect your sheet, describe what you want, and the AI writes the code and builds the chart. If you want to inspect or edit the underlying code you can, but you never have to. The entire workflow can be done without writing a line of SQL or Python. Looker Studio and native Google Sheets charts also require no coding for standard use cases.
Can I combine multiple Google Sheets into one dashboard?
Yes. In Fabi, you can import multiple sheets from the same spreadsheet (or from different spreadsheets) and query them together. This is useful when your data is split across sheets -- sales in one, marketing spend in another, customer data in a third -- and you want a unified view without manually combining them first.
Try Fabi free -- connect your first Google Sheet and publish your dashboard in under an hour.