
.svg)


A new frontier: Data exploration in the age of AI

TL;DR: Vibe analytics isn't a shortcut - it’s a new way of working with data for both data practitioners and data consumers. Data practitioners can leverage vibe analytics to shorten release cycles for new data products and reduce their tech support burdens. Data consumers can leverage it to self-service answers to pressing data questions and work more collaboratively with data practitioners on more complex data projects.
It’s 6am and, somewhere, a data stakeholder just had a great idea. They have a hunch about their business that, if proven correct, could save everyone involved both time and money.
They get to the office, light up their computer, and realize…they have no way to answer their own question. They don’t have the right data. Or they have the data but can’t crunch it on their own.
They ping their buddy, a data engineer. She’d love to help. But she’s staring down a queue of six other data pipeline requests. Maybe she can get some preliminary results back next week…that is, assuming nothing else she owns catches on fire.
What if, instead, data consumers could assemble this data quickly, organize it automatically, ask it anything they wanted, and get accurate, actionable results within minutes instead of months? And what if the data engineering team could then take this prototype and turn it into a production-ready solution, making it highly reliable and available for everyone across the company?
That's the promise of vibe analytics, a new approach to analytics that has the potential to shift the way everyone — both data practitioners and data consumers — works with data.
In this article, we'll take a deep look at what vibe analytics is and how both data practitioners and consumers can benefit from it. We’ll also look at the tech’s promise vs. reality and how to mitigate some of the risks involved.
Vibe analytics uses Generative AI (GenAI) to generate unique insights into data at a fraction of the time required by traditional analytics.
Vibe analytics is modeled after vibe coding, a term coined by one of the fathers of modern AI, Andrej Karpathy. In vibe coding, a software engineer leverages a Large Language Model (LLM) to create the skeleton of a new application from a simple natural language description. Tools like Replit create preconfigured development environments in the cloud and leverage LLMs to generate code that serves as a basis for further coding, publishing, and collaboration.
Similarly, with vibe analytics, users can feed data directly into an LLM, which outputs the base components of a new data product: SQL queries, Python code, AI data visualizations, and an analysis of the data and its meaning.
Using vibe analytics, anyone — not just data practitioners — can feed data and context to an LLM, ask exploratory questions, and receive accurate results. Vibe analytics use cases encompass nearly all exploratory data analysis (EDA) and data workflow use cases, such as:
The best part is that, like with vibe coding, the output of vibe analytics isn’t static. It’s SQL and Python code output in a format, such as a Jupyter notebook, that data practitioners can further edit, test, and refine to meet their precise needs.
Vibe analytics isn’t just a change in how analytics is done. It’s a mindset shift - one that puts conversation and collaboration front and center. It turns analytics from something that data practitioners do (and that business stakeholders passively consume) into an ongoing dialogue between practitioners and consumers. This breaks down existing barriers to data, making insights more accessible.
In a standard data analytics lifecycle, there’s a clear line of separation between data practitioners and data consumers.
Consumers bring their requirements to practitioners, such as a data engineering team. That team then goes off on its own and develops a data pipeline, BI dashboards, and other deliverables. It then presents its work to the data consumers, gathers feedback, and iterates on the solution until it meets the data consumers’ business needs.
A company with a mature data lifecycle process may be able to finish this project with a traditional BI solution in a day or two. This assumes that:
Most of the time, however, that isn’t the case. The task falls instead to a backlogged data engineering team and sits on the back burner for weeks (or months).
In the best case, you end up with yet another dashboard cluttering your BI landscape. That adds to your maze of data and renders other dashboards less impactful. In the worst case, by the time the data engineering team gets to the ticket, the company may have already missed a valuable business opportunity.
It’s also common for data consumers to be shut out of the development process. The result is that requirements are sometimes lost in translation. The rework required to meet their use case further delays the time to business value for data.
Vibe analytics changes this. Instead of just supplying text requirements, data consumers can use vibe analytics to produce a refined example of exactly the output they’re looking for.
For example: A regional sales manager uses Salesforce data to pull a list of top cities by revenue numbers and another list of cities that have the most new customers being added. She wants this sent on a monthly basis to guide her sales strategy.
In the old approach to data analytics, this would require that data practitioners first create a data pipeline to absorb this data into a data warehouse. The manager would have to wait days, weeks, or even months to see preliminary results.
With vibe analytics, she can export the data from Salesforce, build a rapid prototype, and work with data practitioners on editing and refining it collaboratively.
Data practitioners can then leverage this collaborative output to develop a comprehensive solution, incorporating necessary data connectors, error checking, testing, monitoring, etc., to make it available at scale throughout the company. Meanwhile, data consumers can keep using the vibe analytics solution to drive critical business decisions.
Building on the example above, let’s break down the four key stages in any vibe analytics solution.
Who is vibe analytics for? Is it for data practitioners - the data engineers, analytics engineers, and data scientists who create new data pipelines and data products? Or is it for the data consumers - the analysts and business stakeholders who need quick results to drive decision-making?
The short answer is: both!
The longer answer is that vibe analysis is more than just a tool that can be used by both data practitioners and consumers. It’s a new way of working with data that acts as a bridge between the two oft-separated groups, providing an unparalleled degree of collaboration.
Here are some of the ways vibe analysis benefits both data practitioners and consumers:
Data practitioners need to ship more data more quickly than ever before. Vibe analytics enables them to shorten delivery cycles and offload some of their data support backlog.
Prototype new data-driven solutions more quickly. Data practitioners can rely on AI to generate 60% to 80% of a solution, preview it with consumers, incorporate their feedback, and make it production-ready via manual coding. Practitioners can also leverage vibe analysis to quickly test out new ideas or approaches without launching a weeks-long exploratory project.
Provide self-service data with little investment. One major time sink for data practitioners is answering stakeholder questions about data. Traditionally, building out a self-service platform for data is a months-long project. With vibe analytics, practitioners can provide consumers with self-service options in days or hours, reducing their support load dramatically.
Shorten onboarding time. Onboarding new data engineers and data scientists often requires new hires to work with experienced engineers who can show them where everything is and how it works. Vibe analytics can reduce this dependence on senior engineers by providing junior talent with self-service tools for learning about how data is structured and what it means.
Upskill data practitioners. Even experienced data practitioners can use vibe analytics to quickly code up something they can imagine but may not know yet how to express programmatically. Practitioners can rely on vibe analytics to create a v1 cut and then analyze the generated code to build on their existing knowledge.
Save future development effort. Some experts argue that vibe analytics may cut out entire swaths of engineering work. One of the most laborious parts of data engineering is getting the data into the optimal format for analysis. However, if AI can convert data into a “good enough” format for decision-making, then some of that effort may become obsolete.
Data consumers need timely access to data to answer pressing business questions. With vibe analytics, they have greater self-service access to data than ever before. Vibe analytics also provides a new way of working with data engineering teams on more complex data projects.
Provide working examples to engineers instead of verbal requirements. Stakeholders can “vibe” together a prototype within a few hours and then collaborate on subsequent versions with the data engineering team. This reduces “lost in translation” errors by giving both teams a common collaboration tool rooted in natural language commands.
Democratize data access. Consumers no longer need to know SQL, Python, or any other language to extract value from data. This increases the number of people within the company who can work directly with data, thereby reducing the overall load on technical data teams.
LLM-assisted explanations of data also means more people can understand the data they’re seeing better than with traditional AI data analysis tools. Over time, this increases not just data access but overall data literacy across the company.
Accelerate exploratory data analysis. Data consumers who are already skilled with SQL can leverage vibe analytics to cut out the grunt work involved in exploratory data analysis and deliver results more quickly than writing new SQL queries and designing reports by hand.
Eliminate delays in decision-making. Consumers can use vibe-engineered solutions to self-service answers to data questions and test out business hypotheses themselves. That enables data consumers to make fast and nimble business decisions without feeling like engineering is a roadblock.
Vibe analytics can be a transformative tool in nearly any enterprise. However, it’s not the be-all and end-all data analytics solution. Companies that use vibe analytics need to keep a few principles in mind.
Vibe analytics solutions can operate over a wide range of use cases and data volumes - from data spread across a handful of Excel spreadsheets and CSV files to terabyte-sized data warehouses. However, they’re not a replacement for scalable, real-world, business-critical applications.
Vibe-coded solutions often work “good enough” for the isolated purpose they serve. As soon as a few dozen or few hundred people start using it, however, its limitations - in scalability, performance, correctness, etc. - become quickly apparent.
Additionally, vibe analytics won’t yield the best results in all circumstances. In particular, vibe analytics may fall short if:
These cases should be identified early by data practitioners and consumers and tackled with a more serious, traditional data engineering effort.
A key benefit of building formal data pipelines is visibility. The data either resides in a centralized data warehouse or is discoverable via a data catalog.
A vibe analytics solution risks returning to the Bad Old Days of siloed data, where some individuals and teams have access to certain information that other teams can’t even find, let alone use. This artificially limits data’s utility and stymies the type of collaborative effort that leads to improved data quality.
LLMs can make mistakes. That’s particularly true if they aren’t given sufficient data for answering the questions at hand. They may generate code that looks fine but makes an inaccurate assumption about the data at hand.
Data practitioners should be able to read the code generated by a vibe analytics solution and verify that it does what the LLM professes it does. Likewise, data consumers should be close enough to the data to examine a result set and tell if it jibes with their understanding or feels “off.”
Vibe analysis can be an effective tool for increasing data democratization within a company. But before that happens, the organization needs to reach a certain level of data maturity, both from a business and a technical standpoint:
This doesn’t necessarily mean every problem needs a dedicated data pipeline. Vibe analytics works very well operating off a set of spreadsheets, CSV files, and JSON exports. However, anyone who uses data within the company should be familiar with proper procedures for handling sensitive data, such as PII and Intellectual Property (IP).
Additionally, data consumers require a certain level of data literacy for vibe analytics to work. They need to be familiar with their data and how it’s represented.
An organization that wants to incorporate vibe analytics into its culture should have a good sense of who should use vibe analytics and when best to use it. For example, vibe analytics works best when users are already close to the data, can interpret it properly, and can identify if the underlying data makes sense or feels off. Even when using AI, the axiom “Garbage In, Garbage Out” still applies.
Doing vibe analytics right also means using the right AI data analysis tools.
The best vibe analysis is done with AI data analysis tools that are AI-native. An AI-native tool should:
Tools that fall into this category include:
Julius. An AI analysis tool that uses Python and AI to help with academic research and data analysis.
Metabase. An open-source analytics provider that supports natural language search and SQL generation. Available as a hosted service and as a local solution running in a Docker container.
Google Colab. Short for “colaboratory,” Colab is Google’s hosted Jupyter notebook solution. Directly integrates with all Google Gemini multimodal LLMs. Supports SQL, Python, and even a REST API. Google recently re-launched Colab as an “AI-first” solution, Colab AI, that provides natural language assistance for a more iterative and collaborative experience.
Deepnote. An AI-powered data workspace that supports Python, SQL, R, and no-code/low-code development. Leverages your existing business context and data stack to automatically generate powerful analyses and insights out of the box.
Besides these solutions (one which only Julius is AI-native), there are tools such as Sigma and Omni that take a modern approach to analytics but can’t claim to be AI-native. In addition, you have the traditional heavy hitters in analytics, such as Tableau, Looker, and Power BI, each of which is adding AI-assisted workflows to varying degrees.
Of course, we’re biased here, but we personally recommend Fabi, our vibe analytics platform that we built AI-native from the ground up. Fabi is an all-in-one tool for AI data exploration that enables you to generate data applications based on Python and SQL 10x faster than building them from scratch.
As an AI-native tool, Fabi checks off all the above boxes:
To get started with Fabi, create a free account. From there, Fabi will ask you how you want to get started.

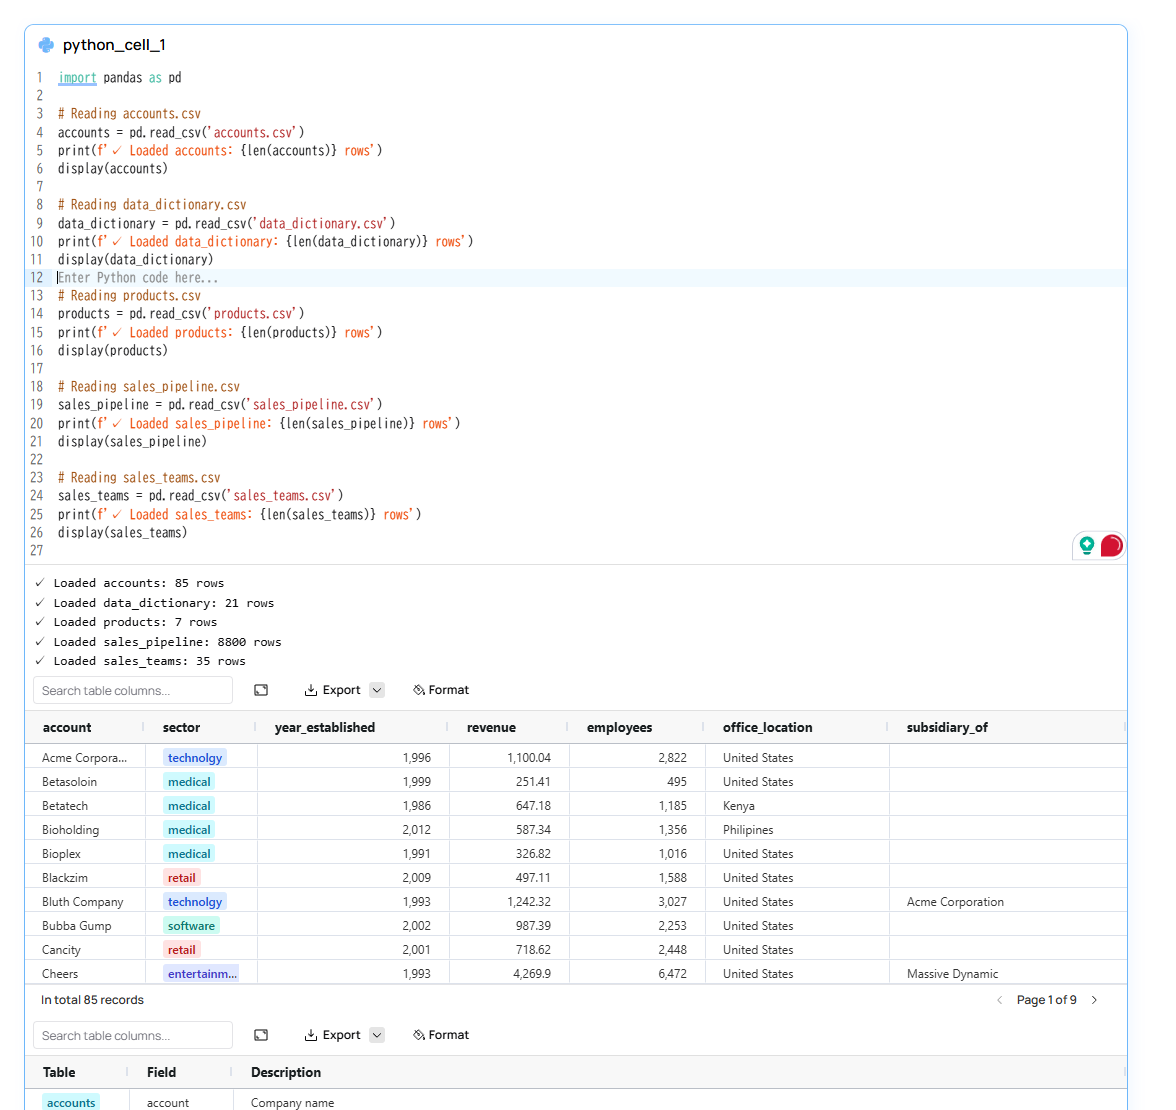
You can then upload your own data and start exploring it. For example, you can upload a set of CRM sales opportunities to explore prospects and analyze trends. Fabi will automatically analyze the data (in this case, five tables spread across five separate CSV files) and automatically generate Python code to load the data.
Using the AI assistant, you can use natural language queries to ask both simple and advanced questions. You can start with a simple question such as “Describe the data,” which will analyze the tables, the contents, and their relationships to one another. Fabi will also suggest additional context-relevant tasks, such as “Show sales performance trends over time.”
Let’s say, for example, that you ask Fabi, “Create a leaderboard of sales agents by total won deal revenue and number of deals.” Fabi will break this down into discrete steps and generate a new potential Smartbook cell containing Python code for each step.
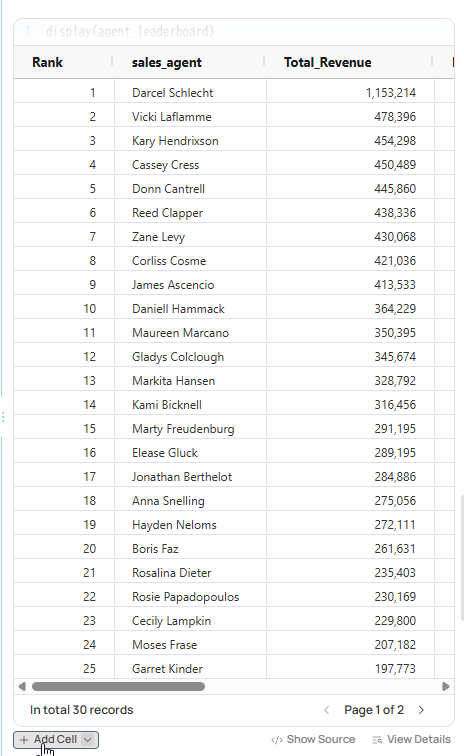
You can select Add Cell to save the Python code that Fabi generated to create these tables and visualizations:
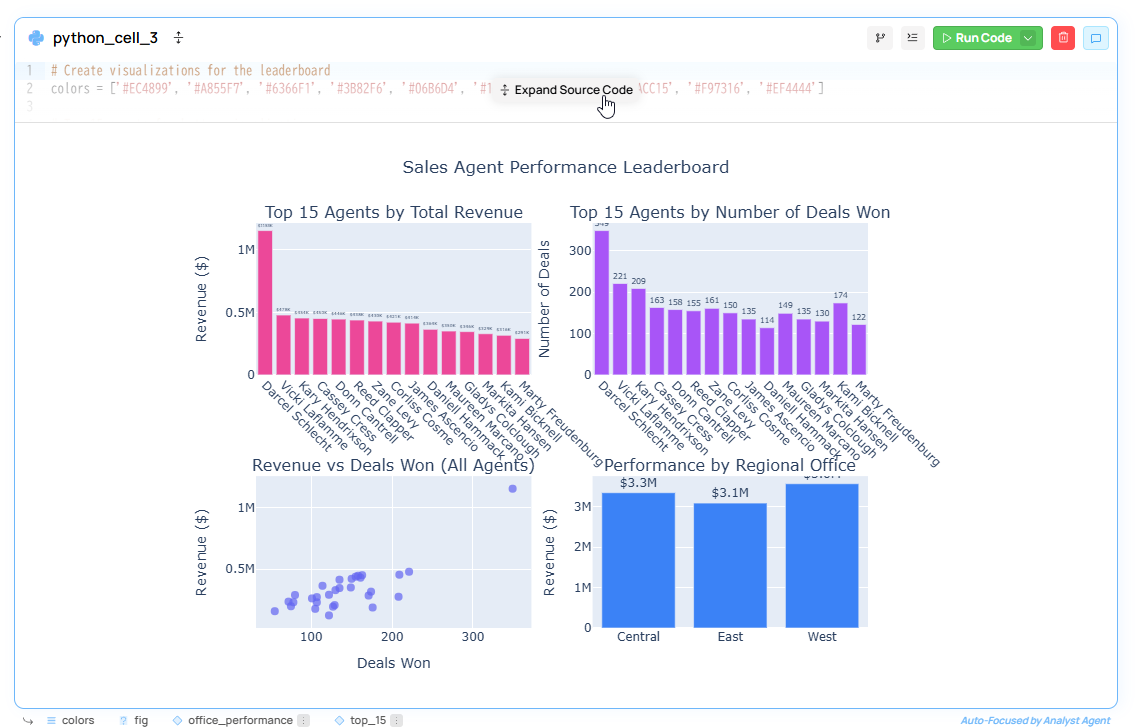
Data consumers can ask further clarifying questions of the LLM to dig deeper into the data or cross-reference it with other data. Data practitioners can edit the Python code directly to add additional filters, refine the visualization to meet business requirements, or add new nodes to the Smartbook to create additional downstream outputs.
No matter the use case, vibe analytics is a useful tool for performing rapid data analysis, testing new hypotheses, and providing self-service answers to common data questions. It can also serve as a powerful new tool for collaboration between data practitioners and data consumers, enabling them to capture data project requirements more accurately.
Vibe analytics can serve as both a starting point and a destination. For data practitioners, it eliminates the drudge work of starting a new data product, accelerating the delivery of new data products. For data consumers, it provides fast, accurate answers to burning questions without overburdening the data engineering team.
This is just the beginning of what you can do with vibe analytics. Want to explore more? Our templates page contains a rich set of additional examples, along with sample data, that you can use to bootstrap a wide range of projects. You can also create a blank Smartbook and upload or connect your own external data sources.
.avif)
