.svg)


Best Alternatives to Powerdrill AI

TL;DR: AI analytics dashboards reduce the time to build and update reports from days to hours by replacing technical workflows with natural language interfaces. Traditional BI tools require SQL expertise and create bottlenecks where data teams spend 78% of their time on busywork rather than insights, with analysts losing 9.1 hours weekly to inefficiencies. Companies like Parasail and Aisle achieved 90-92% reductions in dashboard creation time by enabling non-technical users to query data conversationally, eliminating 40-50 monthly data requests and reducing analysis from weeks to minutes. The shift moves analytics from static reports requiring constant maintenance to conversational insights that update automatically, with platforms like Fabi, Metabase, BlazeSQL, Hex, and Powerdrill offering different approaches based on team needs.
Traditional analytics dashboards require technical expertise to build and hours to update. You need SQL knowledge to query data, dashboard tools to visualize it, and manual work to refresh it weekly. AI analytics dashboards eliminate this workflow entirely. Instead of building static visualizations that require constant maintenance, you ask questions in natural language and get automated insights that update themselves. Research shows that 78% of analysts spend their time on busywork like data prep and tool navigation rather than generating insights. The 5 days to 5 hours shift represents moving from manual dashboard maintenance to automated analysis, where anyone on the team can query data conversationally without technical barriers or waiting for analyst availability.
This transformation is already well underway. Companies like Parasail reduced dashboard creation time by 90%, while Aisle cut analysis time by 92%. These aren't just isolated improvements, they represent a fundamental change in how organizations extract value from data.
Before AI enters the picture, analytics dashboards face several persistent challenges that slow down entire organizations.
The expertise bottleneck creates the most immediate friction. Traditional BI tools require proficiency in SQL and Python, limiting dashboard creation to a small group of technical team members. When Parasail tried using conventional BI tools, they found it would take 2-3 months just to get any sort of dashboard published. For a startup moving quickly, that timeline was unacceptable.
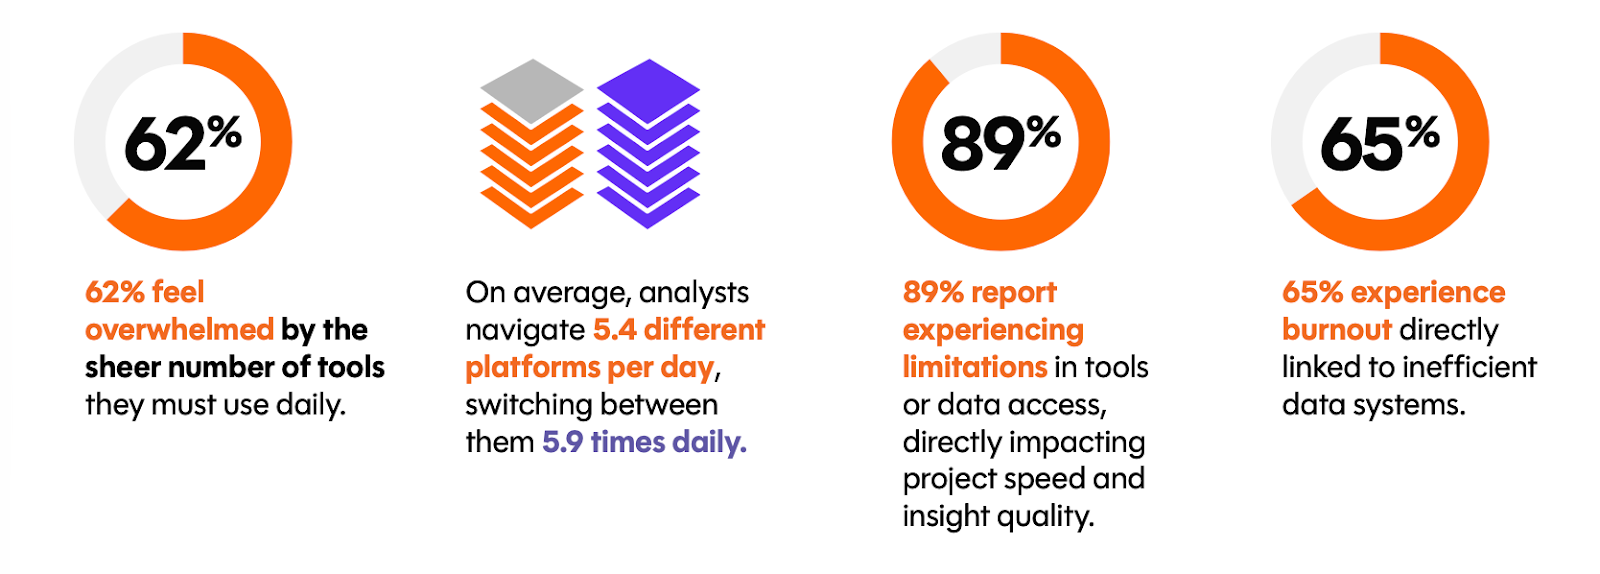
Tool fragmentation compounds the problem. Analysts navigate an average of 5.4 different platforms per day, switching between them 5.9 times daily. This constant context switching doesn't just waste time, it creates mental strain that reduces the quality of insights. Research from dbtLabs found that 62% of analysts feel overwhelmed by the sheer number of tools they must use daily, and 89% report experiencing limitations in tools or data access that directly impact project speed and insight quality.
The dashboard backlog grows faster than teams can address it. At Aisle, the brand team was generating 5-10 ad hoc data requests per week, each taking 30 minutes to two hours to fulfill. That meant 15 hours weekly spent on requests that didn't align with the product and engineering team's priorities. The data team became a bottleneck rather than an enabler.
Static insights age poorly. By the time a dashboard is polished and perfect, the business question has often evolved. Teams need the ability to iterate quickly, but traditional workflows make rapid iteration prohibitively expensive in terms of time and resources.
AI doesn't just make existing workflows faster. It fundamentally changes what's possible with analytics dashboards.
Natural language interfaces replace manual SQL-Python coding, compressing timelines that previously measured in weeks into hours or minutes.
When Parasail implemented an AI-powered analytics platform, the learning curve dropped from 2-3 months to just 4-5 hours. Matt from their team highlighted this shift: "Fabi.ai took us four to five hours to learn. A traditional BI tool would probably have taken us a few months to get any sort of dashboard stood up." This translated to a 90% reduction in dashboard creation time, with tasks that would have taken days now taking hours or minutes.
Aisle saw similar results. Multi-week analytical efforts compressed into 3 days of exploratory analysis. Dashboards and reports that once took hours or days were now completed in just 10-15 minutes, roughly 92% faster.
This speed addresses a critical business question: How long does it take to roll out new dashboards for the team? The answer shifts from weeks to hours, fundamentally changing how organizations can respond to new business questions.
Traditional analytics dashboards require translation. Someone technical builds them, then explains them to business stakeholders. AI eliminates this translation layer.
At Aisle, training the non-technical brand team took just 15 minutes. Soon, they were answering their own data questions rather than waiting on the product and engineering teams. This eliminated 40-50 monthly data requests. Tyler from Aisle's product and customer marketing team explained the impact: "Before Fabi, those insights required looping in our engineering team. Now I can run those analyses myself in minutes."
This democratization solves two persistent challenges: How do we make dashboards easier for non-technical teams to understand? And: How do we add context to dashboards so teams know what the numbers mean?
AI provides context automatically. When someone asks a question in natural language, the response includes not just numbers but explanations of what those numbers represent. The system understands the underlying data structure and can explain relationships without requiring users to reference data dictionaries or documentation.
The most significant paradigm shift is moving from dashboards as end products to dashboards as starting points for conversations they can trust.
At obé Fitness, the data team implemented natural language querying, enabling stakeholders to ask follow-up questions. Instead of building a new dashboard for each question, users could iterate on existing analyses conversationally. The AI capabilities enabled context-aware follow-up answers, improving both the quality and speed of analysis.
Aisle automated their reporting by pushing AI-generated summaries to Slack on a daily and weekly schedule. These automated reports met teams where they work, rather than requiring them to log in to yet another platform to check another dashboard.
This conversational approach addresses multiple challenges simultaneously:
When AI generates analyses from governed datasets, metric definitions are automatically maintained. Everyone using the platform gets the same calculations because they're all drawing from the same verified definitions.
AI transforms analytics dashboards from reactive reporting tools into proactive intelligence systems. AI doesn’t just represent numbers; it actively explores the factors driving those changes to present actionable insights.
Traditional dashboards show you what happened. You see a metric drop, then manually investigate why. AI changes this dynamic by automatically exploring and surfacing contributing factors.
Hologram experienced this firsthand. When they needed customer deep-dive analyses for deal negotiations, the turnaround time was 1-2 days. With AI-powered analytics, that dropped to 30 minutes, a 94% reduction. As Zaied from their data team noted: "With Fabi.ai, we've accelerated our deal negotiation. When I received a request for a customer deep dive analysis going into pricing discussions, I went from a day or two turnaround to 30 minutes."
Lula Commerce took automation further by implementing Python scripts that push alerts to Slack when key thresholds are breached. This enables 24/7 monitoring without constant manual checking. The team eliminated 30 hours per week of manual data work, equivalent to adding nearly a full-time employee's worth of productive capacity.
With AI-powered automation, dashboards become monitoring systems that notify teams of important shifts immediately rather than waiting for the next scheduled report review.
AI can synthesize structured dashboard data with unstructured information, creating a more complete picture than numbers alone provide. This means linking product usage metrics with customer support conversations, or connecting sales data with market trends from various sources.
Traditional analytics dashboards excel at quantitative data but struggle to incorporate the qualitative context that often explains the "why" behind the numbers. AI bridges this gap by processing both data types simultaneously, allowing teams to understand not just what's happening in their metrics, but why it's happening based on customer feedback, support tickets, or market commentary.
The value of AI-powered analytics dashboards extends far beyond faster chart creation.
The real cost of inefficient analytics isn't just frustration, it's measurable time. Each analyst loses 9.1 hours per week to inefficiencies, totaling $21,613 in wasted productivity annually. AI-powered platforms recover most of this lost capacity, but the impact shows up differently across organizations.
At Gauge, the product team finds insights 10X faster than before. This isn't just about getting the same work done quicker, it's about being able to ask and answer more questions, test more hypotheses, and make better decisions.
obé Fitness saw its analysis time drop by 75%. Think about what that means practically: one analyst can now accomplish what previously required four people. That's not a marginal improvement, it's a complete transformation in analytical capacity.
For REVOLVE's data team, the efficiency gains enabled them to shift their focus. Instead of drowning in basic reporting requests, they could handle more complex analyses and strengthen their organization's culture of data-driven decision-making. The time savings compound when teams can focus on strategic questions rather than routine reporting.
Parasail delayed the need to hire dedicated data science personnel by implementing AI-powered analytics. Their 90% reduction in dashboard creation time meant their existing team could handle workloads that would typically require additional headcount.
Aisle's elimination of 40-50 monthly data requests saved them from needing to hire additional analysts just to keep up with basic reporting needs. The product and engineering teams could focus on strategic work instead of fielding constant data requests.
When a platform eliminates the need to hire even one analyst (at a median salary of $95,000+ plus benefits and overhead), it pays for itself many times over.
Faster insights mean capturing opportunities competitors miss. When time-to-insight drops from days to hours, organizations can test hypotheses, validate assumptions, and adjust strategy while competitors are still waiting for their first report.
Aisle's pilot program evaluations dropped from 2-3 weeks to just a few hours. This speed lets them run more experiments, learn faster, and optimize their platform more quickly than would be possible with traditional analytics approaches.
Better data visibility reduces the number of engineering, marketing, and operations cycles spent pursuing the wrong priorities. Fast, accessible analytics let teams fail fast on bad ideas and double down on good ones. When teams can quickly validate or invalidate assumptions with data, they avoid building the wrong features, targeting the wrong customers, or optimizing the wrong processes.
Building custom dashboards gives you complete control but requires dedicated engineering resources. Open-source solutions like Metabase offer flexibility without licensing costs, but still need technical setup, server maintenance, and someone who understands the tool's architecture. Commercial BI tools provide support and polish but come with steep learning curves, high per-seat costs, and rigid structures.
AI analytics dashboards change this equation by removing technical barriers entirely. Natural language interfaces mean non-technical users can query data without learning SQL, dashboard builders, or tool-specific syntax. Teams get the flexibility of custom-built solutions with the ease of asking questions conversationally.
When evaluating whether to build dashboards in-house or use an AI analytics dashboard tool, consider:
Current team SQL proficiency: If most team members can't write SQL, traditional BI tools will create a bottleneck. AI-powered platforms let non-technical users be productive immediately.
Volume of dashboard requests: High request volumes overwhelm small data teams. Self-service reduces this burden, but only if the tool is actually accessible to non-technical business stakeholders.
Need for custom analysis: Standard dashboards work for standard questions. When business questions get complex or change frequently, you need the flexibility to iterate quickly.
Integration with existing data infrastructure: The platform should connect to your data without requiring extensive ETL.
Research shows that 93% of analysts believe an all-in-one governed platform would increase productivity, and 97% want governed self-service platforms. The scalability question of whether the current stack is scalable, or if we need something more robust, often comes down to whether the platform can grow with the organization without requiring linear increases in data team size.
The market for AI-powered data visualization has matured quickly. Here are six platforms that represent different approaches to the problem:
Best for: Startups and growth-stage companies that need full analytical flexibility without data team overhead.
Fabi combines conversational AI with SQL, Python, and no-code capabilities in a unified notebook environment. Teams like Parasail and Aisle have achieved 90-92% reductions in dashboard creation time by enabling non-technical users to generate analyses through natural language. The platform connects directly to data warehouses like Postgres, BigQuery, and Snowflake, with automated reporting to Slack and Google Sheets. The standout feature is the speed of adoption. Companies report becoming productive in 4-5 hours, rather than months with traditional BI tools.
Best for: Teams that value open-source transparency and want self-hosted options alongside cloud deployment.
Metabase offers an open-source foundation, including Metabot, its AI assistant that handles natural language querying, SQL generation, and result explanations. The platform appeals to teams wanting control over their analytics infrastructure without vendor lock-in. Metabot can be embedded as a React component for customer-facing analytics. With startup-friendly pricing and both cloud and self-hosted options, Metabase works well for teams that want to start simple and scale gradually while maintaining full visibility into their BI stack.
Best for: Teams needing direct database access through natural language queries without requiring SQL expertise.
BlazeSQL focuses specifically on translating natural language questions into SQL queries, connecting directly to your database to retrieve answers. The platform learns your database schema and generates SQL code that users can review and modify. This transparency appeals to teams who want to understand exactly how their queries are constructed while still benefiting from AI assistance. However, BlazeSQL operates primarily as a query interface rather than a full analytics environment. You'll need separate tools for data transformation, visualization, and collaboration. Best suited for teams who already have established BI tools and want to add conversational database access.
Best for: Data teams seeking collaborative notebook environments with built-in SQL, Python, and visualization capabilities.
Hex provides a notebook-based workspace where data teams can combine SQL queries, Python code, and interactive visualizations in a single environment. The platform emphasizes collaboration, allowing multiple team members to work together on analysis projects with version control and commenting. Hex has added AI features to assist with code generation and debugging, though the core experience remains centered on the notebook paradigm. This makes it powerful for teams comfortable with code-based workflows but less intuitive for business users who prefer conversational interfaces. Best used when your data team needs a collaborative space for complex analysis rather than self-service access for non-technical stakeholders.
Best for: Teams needing ultra-fast file-based analysis and automated insight generation from spreadsheets and CSVs.
Powerdrill emphasizes speed—processing data up to 100 times faster than traditional methods, according to their benchmarks. The platform excels at quick analysis of uploaded files (Excel, CSV, PDF) without requiring database setup. Powerdrill Bloom automatically analyzes data, detects patterns, and generates presentation-ready reports and infographics. The automated insights feature makes it valuable for teams that need to explore data and quickly create shareable outputs. Less suited for complex database queries but strong for rapid file-based exploration.
Choosing between approaches:
Each platform optimizes for different workflows and team structures. The key is matching the tool to how your team actually works:
The architecture matters less than the workflow fit. A free tool that matches your team's work patterns will deliver more value than an expensive platform that requires changing how everyone works.
Walk into any organization using traditional BI tools and you'll find the same problem: hundreds of dashboards that nobody looks at anymore. Teams built them "just in case" someone might need them someday. Six months later, those dashboards sit untouched, slowly going stale as the business evolves around them.
AI changes this dynamic through conversational interfaces. Instead of building multiple static views to anticipate every possible question, teams start with core dashboards and explore variations through natural language. Need to see last quarter's numbers broken down differently? Just ask. Want to compare a different set of segments? The conversation continues without creating yet another permanent dashboard.
The most significant shift is psychological. When stakeholders know they can generate the specific analysis they need in minutes, the pressure to create "just in case" dashboards disappears. They stop requesting permanent dashboards for every hypothetical scenario because they trust they can get answers when questions actually arise. The result is a leaner, more focused set of dashboards that people actually use.
The transformation from 5 days to 5 hours represents more than incremental improvement. It's a fundamental change in how organizations extract value from data.
AI doesn't just make analytics dashboards faster; it makes them more accessible, more contextual, and more actionable. The fundamental transformation is moving from dashboards as end products to dashboards as starting points for conversation.
Organizations that embrace this shift see reductions of 75-92% in analysis time. They transform data bottlenecks into a competitive advantage. Teams that were waiting days or weeks for insights now get answers in minutes or hours. Non-technical stakeholders who were dependent on data teams become self-sufficient.
The evidence is clear across companies like Parasail, Aisle, Hologram, obé Fitness, and others. The pattern is consistent: AI-powered analytics platforms don't just improve existing workflows, they enable entirely new ways of working with data.
The question isn't whether to modernize analytics dashboards. It's whether you'll do it before your competition does. In a market where decision velocity determines winners, the organizations that can move from question to insight in hours rather than days have a significant advantage. The shift to AI-powered analytics dashboards isn’t coming, it's already here.
Be a part of this new wave of AI for BI and try out Fabi’s interactive dashboards at www.app.fabi.ai