.svg)


Best Alternatives to Powerdrill AI

TL;DR: When you're spending more time collecting data than analyzing it, you've hit the spreadsheet wall. The point where manual exports and reformatting become the bottleneck to decision-making. Database reporting tools fall into six categories, from basic SQL clients for technical users to enterprise BI platforms that require dedicated data teams, but AI-powered platforms like Fabi are changing the game by letting anyone ask questions in natural language and get instant answers. Instead of waiting until you're "big enough" to invest in proper analytics or over-buying complex enterprise tools that sit unused, startups can now enable self-service analytics from day one. The right tool matches your current stage and team capabilities, because every week you delay is another week of slower learning and decisions made on gut instead of data.
If you started with spreadsheet exports for tracking key metrics but now manually running SQL queries, exporting CSVs, and reformatting data multiple times per week, you've hit the spreadsheet wall. This was my story as the only growth marketer at Fabi. I had to report on performance marketing, social media, lifecycle marketing, newsletter metrics, website performance and a few more. I was working out of 7+ applications and exporting CSVs or manually filling out spreadsheets to build my reports for strategic meetings with the executives. Even after pulling together all my metrics into a master spreadsheet, I was not finding insights, or trends to fuel our decisions. It wasn’t the lack of data, but the fatigue of collecting and preparing the data which left me little time to analyze and get the answers I need.
Research shows that analysts spend 10-11 hours per week just collecting and preparing data, and 76% of teams still rely on spreadsheets for data cleaning, even in established teams. The conventional wisdom says, "We'll invest in proper analytics when we're bigger," but poor analytics infrastructure compounds as you grow. Starting right prevents the costly migration from makeshift solutions to proper database reporting tools.
You've hit the inflection point when:
The good news? Modern database reporting tools span a broad spectrum, from simple SQL clients to AI-powered platforms that enable natural language queries. Here are six categories for database reporting tools according to your technical expertise level and company size.
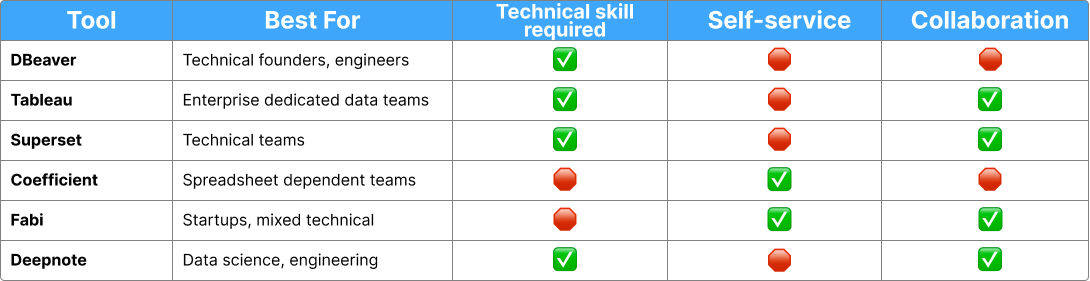
SQL clients such as DBeaver, TablePlus, DataGrip, or pgAdmin let you write SQL queries directly against your database and visualize the results. These are best for technical founders and engineers comfortable with SQL and ad hoc analysis, and for small teams where 1-2 technical people handle all data questions at early-stage startups (pre-seed to seed) with minimal reporting needs.
The advantages include low cost ($0-$200/year per seat), direct database access without abstraction layers, speed for technical users who know SQL, and no learning curve for those who already know the language. The drawbacks? Zero self-service for non-technical team members, no version control or collaboration features, results that don't turn into shareable dashboards, every analysis starting from scratch, and no governance or row-level security.
Choose SQL clients when you're a technical founder, pre-product-market fit, the entire team is technical, and you just need to run queries occasionally. This is a starting point, not a scaling solution. For example, a technical founding team of three at the pre-seed stage, checking user cohort retention once a week, can use TablePlus for $89/year and get the job done.
Tableau, Looker, and Power BI are enterprise business intelligence platforms designed to create dashboards and reports, with drag-and-drop interfaces and SQL layers. These work best for companies with dedicated data teams, organizations needing extensive dashboarding, teams comfortable with steep learning curves, and situations where stakeholders primarily need dashboards rather than ad hoc queries.
Traditional BI tools offer powerful visualization capabilities, industry-standard platforms that future hires will be familiar with, the ability to handle complex data modeling, and enterprise-grade governance features. However, they're expensive ($70-$1,200+ per user per month), have steep learning curves (2-3 months to proficiency), require a semantic layer and data modeling upfront, aren't designed for ad hoc exploration, represent overkill for early-stage companies, and use a dashboard-first design that makes answering new questions slow.
Choose traditional BI when you've raised Series A or later, have a dedicated data person, and need standardized reporting for a large organization. Don't choose this route if you lack someone dedicated to building and maintaining the semantic layer, or if your questions change too frequently for rigid dashboard structures. Looker starts at $5,000/month, Tableau costs $70-$165/user/month, and Power BI costs $10-$20/user/month but requires the Microsoft ecosystem.
Metabase, Redash, and Superset represent lighter-weight, open-source or freemium database reporting tools that balance SQL access with visualization capabilities. They're ideal for technical teams wanting some dashboard capabilities without enterprise-level complexity, startups enabling semi-technical stakeholders, teams needing both ad hoc SQL queries and saved dashboards, and budget-conscious seed-to-Series A companies.
Modern BI tools cost much less than traditional options ($0-$85/month for Metabase Cloud), can be self-hosted in open-source versions for free, provide SQL query interfaces and dashboard builders, start faster than Tableau or Looker, and offer a good balance of flexibility and structure. The limitations include less advanced visualization options, fewer enterprise governance features, self-hosted versions requiring maintenance, the need for SQL knowledge for ad hoc queries, and a lack of AI-powered capabilities.
Choose modern BI when you have 2-3 people who can write SQL, need to create dashboards for stakeholders, and want to keep costs low at the seed to Series A stage while building your first proper data stack. A team of 15 might use Metabase Cloud ($85/month) for operational dashboards, with 3 SQL-proficient team members creating reports for the rest of the company.
Google Sheets connectors, Coefficient, and Actiondesk sync database data directly into Google Sheets or Excel, letting teams work in familiar spreadsheet interfaces. These work best for teams deeply entrenched in spreadsheet workflows, for quick data pulls for one-off analysis, for financial planning and budgeting, and for non-technical users who need raw data rather than dashboards.
Spreadsheet-native tools work in familiar environments, have lower learning curves for non-technical users, suit financial models and planning well, and cost relatively little ($10-$50/user/month). However, they don't scale well because large datasets break spreadsheets, lack proper version control, have data freshness issues, encourage copy-paste culture, make governance enforcement hard, and can't handle complex queries easily.
Choose these when your finance or operations team needs database data but won't learn SQL or BI tools, and you need a bridge solution while building a proper analytics infrastructure. Don't choose this route if you're trying to make a scalable analytics practice; this is a band-aid, not a solution.
Fabi.ai, Julius, Powerdrill, and BlazeSQL use AI to understand your data schema, write queries in natural language, and enable both technical and non-technical users to get insights. These platforms are best for startups needing self-service for non-technical team members, teams without dedicated data analysts, organizations valuing speed over extensive dashboarding, companies seeking both exploration and reporting in one tool, and seed-to-Series B companies building their first analytics stack.
AI-powered database reporting tools let non-technical users self-serve through natural language queries, use AI that understands your data schema (requiring less upfront modeling), bridge the gap between SQL experts and business users, combine ad hoc exploration with dashboard creation, deliver faster time-to-insight than traditional BI, work directly with SQL and Python, and enable collaboration within the tool.
The limitations include being a newer category with less-established best practices, some platforms still maturing their features, potentially still requiring SQL for complex analysis, and pricing that varies widely by platform. Typically, these tools cost $50-$500/month for small teams, scaling based on usage and team size, significantly cheaper than enterprise BI while more capable than SQL clients.
Choose AI-powered platforms when you have a mix of technical and non-technical team members, need fast answers to changing questions, and want to enable self-service without hiring a data team first. You shouldn't have to wait until you're "big enough" to invest in proper database reporting tools.
Real examples demonstrate the impact: Hologram reduced analysis time by 94% using Fabi, enabling their analyst to answer questions during live sales calls instead of days later. Aisle eliminated 40-50 monthly ad hoc requests when their non-technical brand team started self-serving with just 15 minutes of training. Gauge set up full analytics in 10 minutes instead of months of building custom infrastructure.
Hex, Deepnote, and Observable are collaborative data science notebooks that combine SQL, Python, visualizations, and documentation in one interface. They're best for technical teams comfortable with code, data science, and analytics engineering, companies building complex models and analyses, and teams needing reproducible, version-controlled analysis.
Data notebooks are very flexible (combining SQL, Python, and R), great for complex analysis and data science, version-controlled and collaborative, can publish as dashboards or apps, and use modern tooling with AI assistance. However, they require programming knowledge, have steeper learning curves for non-technical users, can be overwhelming for simple reporting needs, and have pricing that can add up ($10-$100/user/month).
Choose notebooks when you have a technical team doing complex analysis, building models, or needing reproducible research-style workflows. You're comfortable with code and want notebook-style interfaces. These aren't right if you need to enable non-technical stakeholders to self-serve. Notebooks are powerful but not accessible to most business users.
Start by assessing your team composition. If everyone is technical (engineers and founders), start with SQL clients and grow into modern BI tools or AI-powered platforms. With a mix of technical and non-technical team members, start with AI-powered platforms for self-service or modern BI tools if you have someone to build semantic layers. For mostly non-technical users like me (sales, marketing, operations), start with AI-powered platforms like Fabi with natural language and avoid SQL clients, notebooks, or complex BI.
Define your primary use case. For ad hoc exploration and answering changing questions, AI-powered platforms, SQL clients, or notebooks work best—avoid traditional BI because it's too rigid. For standardized monitoring dashboards, modern BI or AI-powered platforms that create them work well. For customer-facing analytics, only embedded analytics will do. For financial planning and modeling, use spreadsheet-native tools as a bridge, combined with AI-powered database reporting tools for queries.
Consider your budget constraints. At the bootstrap or pre-seed stage, with less than $100/month available, SQL clients or open-source modern BI work, though you'll need to migrate later. At the seed stage, with $100-$1,000/month, modern BI tools or AI-powered platforms hit the sweet spot for value without enterprise costs. At Series A and beyond with $1,000-$10,000+/month, you can consider traditional BI if you have dedicated data resources, or scale AI-powered platforms for broader adoption.
Think about your growth trajectory. Will you hire a data analyst in the next 12 months? How fast is your data volume growing? Will you need to enable 10+ non-technical users? Do you need governance and permissioning? If hiring a data analyst soon, choose tools that a professional will want to use, modern BI or AI-powered platforms, not just SQL clients. If enabling many users, prioritize self-service capabilities and governance features. If data volume is exploding, ensure the tool can handle scale, or plan your migration path.
Waiting too long to invest: The belief that "We'll get proper analytics when we hire a data person" leads to months of inefficient manual reporting and poor decisions. The cost includes founders spending 5-10 hours weekly on manual query runs, decisions made on gut rather than data, delayed product iterations due to a lack of insights, and different team members reporting different numbers. Start with appropriate database reporting tools for your stage, even $50/month beats spreadsheet chaos.
Over-buying for your stage: When seed-stage startups sign $60,000/year Looker contracts because "it's what grown-ups use," the tool sits unused primarily because no one learned it. Overkill features require dedicated maintenance, and cash burns on vendor licenses rather than on product development, match tool complexity to team capability and current needs. You can always migrate later.
Choosing based on the wrong criteria: Bad criteria include "I heard Company X uses this," "This is the cheapest option," or "Our investor recommended this." Good criteria involve asking whether your team has the skills to use this effectively, whether it can handle your current volume and use cases, whether it will enable self-service for the people who need it, and what the real cost is, including implementation and training.
Ignoring the migration tax: Starting with spreadsheets, moving to SQL exports, then trying modern BI, and then starting over with AI-powered tools means each migration takes weeks of engineering time, results in the loss of historical dashboards and queries, and resets team learning curves with each tool. Think two stages ahead and choose a tool that works now but can scale to your next stage.
The belief that you need to "wait until you're big enough" to invest in proper database reporting tools is outdated. In my case it was a matter of finding a tool that connecting to all the apps I was already using, and being able to ask question in English and getting answers instantly with a AI-powered analytics tool like Fabi.
The right database reporting tools depend on three factors: your team's technical capabilities, whether you need self-service for non-technical users, and your primary use case (exploration versus monitoring). You don't need a data analyst to start making data-driven decisions. In fact, the right tools can delay or even eliminate the need for that first analyst hire, letting you invest that $95,000+ salary in product development instead.
Modern AI-powered platforms have made it possible for startups to enable data-driven decision-making without dedicated data teams. When our customers reduced analysis time, eliminated their entire request backlog, or set up analytics in 10 minutes instead of months, they weren't companies with massive data teams. They were startups choosing database reporting tools that matched their stage.
Database reporting tools are not a luxury reserved for later-stage companies with data teams. They're infrastructure for data-driven decision-making, and every week you delay implementing them is a week of slower learning, worse decisions, and compounding inefficiency. Start with the right tool for your current stage. Your future analyst will thank you for setting up proper infrastructure instead of handing them a mess of spreadsheet exports and ad hoc SQL queries.