.svg)


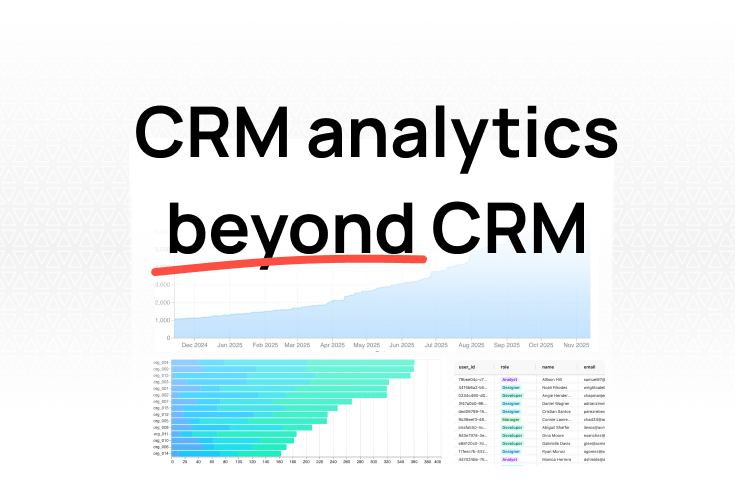
CRM analytics beyond your CRM: how to build reports your sales tool can't

TL;DR: For RevOps and GTM teams that need to combine CRM data with billing, product, and marketing data, Fabi.ai is the best option — ask questions in plain English across all your sales data sources without SQL or report builders. Salesforce is the most powerful native CRM dashboard but requires admin expertise. HubSpot Sales Hub works well for SMBs that want sales, marketing, and CRM in one platform. Clari is purpose-built for revenue forecasting and pipeline intelligence. Coefficient is the best option for teams that live in Google Sheets and want live CRM data without leaving their spreadsheet.
RevOps teams sit at the intersection of sales, marketing, and customer success data. The job is to make sure the full revenue engine is visible, measurable, and running efficiently.
The problem: most sales dashboard tools only see one piece of that picture.
Your CRM shows pipeline and activity. Your billing system shows actual revenue. Your marketing platform shows where leads came from. Your product database shows usage signals that predict whether a deal will close. No single tool natively combines all of this — which is why RevOps teams end up spending their time stitching data together in spreadsheets instead of analyzing it.
A good sales dashboard for RevOps and GTM should connect these sources, update automatically, and make it easy to investigate when numbers move. Here are five tools that approach this problem differently, with honest assessments of where each one fits.
The requirements are different from what a solo sales rep or marketing manager needs. RevOps teams are building the operating system for revenue. That means:
Cross-system visibility. Pipeline data from the CRM, revenue from billing, lead source from marketing, product usage from the application database. A dashboard that only shows CRM data gives you half the picture.
Forecast accuracy. The ability to compare forecast vs. actual, track pipeline coverage ratios, and identify where forecasts consistently miss. This is one of the most asked-about metrics in board meetings and leadership reviews.
Flexibility to define your own metrics. Every company defines "qualified pipeline" or "marketing-influenced revenue" slightly differently. A tool that locks you into its definitions will never match how your team actually operates.
Self-serve for stakeholders. The VP of sales shouldn't need to file a ticket with RevOps every time they want to slice pipeline by segment. Ideally, anyone with access can explore the data themselves.
We built Fabi for the exact problem RevOps teams face: answering questions that span multiple systems.
How it works: Connect your CRM (HubSpot, Salesforce), billing system (Stripe, Chargebee), product database (Postgres, MySQL), and 100+ other sources. Then ask questions in plain English:
"What's our win rate by lead source this quarter?"
"Show me pipeline coverage ratio for Q2 — include only deals created in the last 90 days."
"Which reps have the highest close rate on deals where the prospect used the free trial?"
"Compare forecast vs. actual closed revenue by quarter for the last year."
Every answer shows the SQL behind it. You can verify the logic, adjust the definitions, and share the result as a dashboard that updates automatically.
Why it works for RevOps and GTM:
Where it's less ideal: If your primary need is AI-driven sales forecasting with deal-level risk scoring, Clari is more purpose-built for that specific workflow.
Pricing: Free tier available. Startup-friendly paid plans.
Salesforce is the default CRM for many sales organizations, and its built-in dashboards and reporting are the most feature-rich of any CRM on the market.
Why it's good:
If your pipeline data lives in Salesforce, the native dashboard builder gives you a lot without any additional tools. Drag-and-drop report creation, real-time pipeline views, opportunity tracking by stage, rep performance leaderboards, and forecast rollups — all built in.
The report builder supports cross-object reporting (joining accounts, contacts, opportunities, and custom objects), scheduled report delivery, and role-based visibility. For RevOps teams that have invested in a well-structured Salesforce instance, the reporting capabilities are deep.
Einstein Analytics (now CRM Analytics) adds AI-driven insights, predictions, and more advanced visualizations for teams on Enterprise or Unlimited plans.
The AppExchange ecosystem means you can extend reporting with add-ons if the native capabilities fall short for a specific use case.
Where it falls short:
Salesforce dashboards only see Salesforce data. Actual collected revenue from Stripe, product usage from your database, marketing attribution from Google Analytics — none of this is natively available. You can push data into Salesforce via integrations, but that adds complexity and maintenance.
The report builder is powerful but not intuitive. Building custom reports requires understanding report types, cross-filters, bucket fields, and formula fields. Most sales teams rely on a Salesforce admin or RevOps specialist to build and maintain reports — it's not self-serve for most users.
There are hard limits: 2,000 rows in formatted reports, charts capped at 250 groups, and lower-tier plans (Essentials, Starter) have significantly reduced reporting capabilities.
Pricing reflects enterprise positioning. Even for small teams, Salesforce is a substantial investment — and the best reporting features require higher tiers.
Pricing: Starter from $25/user/month. Professional from $80/user/month. Enterprise from $165/user/month. Unlimited from $330/user/month. CRM Analytics is an add-on.
HubSpot Sales Hub is the CRM and sales tool of choice for many SMBs and startups, especially those already using HubSpot for marketing.
Why it's good:
The biggest advantage for GTM teams is that sales and marketing live in the same system. When a marketing campaign generates a lead that becomes a deal, the attribution is native. You don't need to stitch data across platforms to answer "which marketing activities generate the most pipeline."
The dashboard builder is more approachable than Salesforce's. Drag-and-drop report creation, pre-built dashboard templates for pipeline, deal forecasting, and rep activity — accessible to non-technical users. RevOps can set it up; sales managers can use it without training.
Deal forecasting and pipeline management are solid on Professional and Enterprise plans. Weighted forecasts based on deal stage probabilities, pipeline coverage views, and goal tracking give sales leadership the visibility they need.
The free CRM is genuinely usable, which means small teams can start with HubSpot without committing to paid plans before they're ready.
Where it falls short:
Advanced reporting is locked behind expensive plans. The free and Starter tiers offer basic dashboards. Custom reports, advanced analytics, and higher dashboard limits require Sales Hub Professional ($90-100/seat/month) or Enterprise ($150/seat/month), plus mandatory onboarding fees ($1,500-$3,500).
Like Salesforce, HubSpot dashboards only see HubSpot data. If you track revenue in Stripe, product usage in Postgres, or run ads through platforms outside HubSpot, that data doesn't appear natively. Third-party connectors or manual imports are needed to fill the gaps.
Custom metric definitions are constrained by HubSpot's data model. If your team measures pipeline in a way that doesn't map cleanly to HubSpot's default deal properties, workarounds get clunky.
Pricing: Free CRM (basic dashboards). Sales Hub Starter from $15/seat/month. Professional from $90/seat/month + $1,500 onboarding. Enterprise from $150/seat/month + $3,500 onboarding.
Clari isn't a general-purpose dashboard tool. It's a revenue platform built specifically for forecasting accuracy, pipeline inspection, and revenue leak detection.
Why it's good:
Clari's core strength is forecasting. It pulls data from your CRM, email, calendar, and conversation tools to build a real-time view of pipeline health that goes beyond what reps enter manually. AI-driven predictions surface which deals are likely to close, which are at risk, and where the forecast is soft.
Pipeline inspection is where Clari shines for RevOps. Flow and Trend analytics show how pipeline is moving — what was added, what progressed, what slipped, and what was lost — over any time period. This is the analysis RevOps teams typically build manually in spreadsheets.
Revenue leak detection identifies where deals stall, where discounts erode value, and where handoff breakdowns between stages lose pipeline. For GTM teams focused on revenue efficiency, these insights are hard to get elsewhere.
Clari Copilot (formerly Wingman) adds conversation intelligence — recording calls, surfacing key moments, and coaching reps based on what's actually said in meetings.
Where it falls short:
Clari is enterprise-priced and quote-based. There's no published pricing, and the total cost (core platform + Copilot + Groove sales engagement + implementation) can be substantial. For a 10-person startup, this is likely overkill and out of budget.
It's focused on CRM and activity data. Clari doesn't natively combine billing system revenue, product usage, or marketing attribution data the way a cross-source analytics tool would. It's excellent at the CRM + communications layer but doesn't extend to the full data stack.
Setup is more involved than lighter tools. Implementation typically requires RevOps involvement to configure forecasting categories, map sales stages, and align data fields. Plan for weeks, not days.
The primary use case is forecasting and pipeline intelligence. If you need custom ad hoc analysis, explore-anything flexibility, or dashboards that combine non-CRM data, you'll need a complementary tool.
Pricing: Quote-based. Modular pricing for core platform, Copilot, and Groove. Enterprise-focused — expect significant investment.
Coefficient takes a different approach entirely. Instead of pulling your data into a new dashboard tool, it brings live CRM data into Google Sheets — the tool your team is probably already using daily.
Why it's good:
If your sales team already runs pipeline reviews in Google Sheets, Coefficient removes the manual export step. Connect your CRM (Salesforce, HubSpot, Pipedrive), and your spreadsheet populates with live data that syncs automatically. No more Monday morning CSV downloads.
The two-way sync is a standout feature. Pull data from your CRM into Sheets, but also write data back. Update a deal stage in your spreadsheet and it syncs to Salesforce. For teams that manage pipeline in spreadsheets (more common than anyone admits), this is genuinely useful.
Pre-built sales dashboard templates give you pipeline, revenue, and rep performance views that populate automatically with your CRM data. The templates use standard Google Sheets charts and formatting, so they're easy to customize without learning a new tool.
Alerts trigger Slack or email notifications when data changes — a deal moves to a new stage, pipeline drops below a threshold, a rep's activity falls behind pace. Useful for RevOps teams monitoring pipeline health without staring at a dashboard all day.
Pricing is accessible. The Starter plan ($49/month) includes 3 data sources and works for small teams. The Professional plan ($99/month billed annually) supports 25 data connections and team collaboration.
Where it falls short:
You're still in Google Sheets. The visualization capabilities are limited to what Sheets can do — which is fine for basic charts but nowhere near what a dedicated dashboard or analytics tool offers. Complex visualizations, drill-downs, or interactive filtering aren't possible.
Cross-source analysis requires manual formulas. If you pull Salesforce data into one sheet and Stripe data into another, combining them means writing VLOOKUP or query formulas yourself. There's no AI or natural language layer to handle cross-source questions.
Performance degrades with large datasets. Google Sheets has a cell limit, and pulling thousands of CRM records with frequent auto-refresh can make the spreadsheet slow.
It's a tactical solution, not a strategic one. Coefficient is excellent for getting live CRM data into the tool your team already uses. It's less suited for deep analysis, cross-source investigation, or the kind of flexible querying that RevOps teams need for ad hoc questions.
Pricing: Starter $49/month (3 data sources). Professional $99/month billed annually (25 connections). Enterprise pricing available.
You need to combine CRM data with billing, product, or marketing data.Start with Fabi. It's the only tool on this list that lets you ask cross-source questions without engineering support. When leadership asks "what's our actual collected revenue by lead source?" you answer in seconds, not days.
You're a Salesforce shop with an experienced admin or RevOps team.Lean into Salesforce's native dashboards. Extend with CRM Analytics if you need advanced visualizations. Just budget for the admin time to build and maintain reports.
You're an SMB that wants sales and marketing visibility in one platform.HubSpot Sales Hub gives you the most integrated GTM view for the least integration work. Expect to upgrade to Professional for meaningful reporting.
Your biggest pain point is forecast accuracy and pipeline inspection.Clari is purpose-built for this. If you're an established revenue team willing to invest in enterprise tooling, the forecasting and pipeline intelligence are best-in-class.
Your team lives in Google Sheets and just wants live CRM data there.Coefficient eliminates the manual export cycle. It won't give you deep analytics, but it meets your team where they already work.
The best sales dashboard for RevOps and GTM teams isn't the one with the most features. It's the one that connects the data sources your revenue engine actually runs on, updates without manual work, and lets anyone on the team investigate when the numbers don't add up.
Try Fabi free — connect your CRM, billing, and product data and build your first sales dashboard in minutes, not weeks.