
.svg)


Getting started with Python interactive charting libraries
TL;DR: Python Dash boards are the single most powerful way to build custom dashboards suited specifically to your needs and also bring the exploratory data analysis (EDA) phase and reporting phase into a single environment. The most popular frameworks are Stremlit for simple dashboards and Plotly Dash for more advanced dashboards. If you're looking to build production-grade applications, you could consider Flask or Django. In this post we also show you how to build and share a Python dashboard in Fabi.ai in less than 10 minutes if you're looking for a solution that's both powerful and easy to use.
Three things are true:
Combine these and you end up with: It’s becoming easier than ever to generate more advanced and custom dashboards than any legacy BI has ever allowed you to do in the past with Python dashboards.
We’re not just seeing data analytics and science teams turn more towards Python dashboards, founders and product managers are building their own dashboards because they can't wait three months for IT to deliver a report. Product managers are embedding live model predictions directly into their analytics because they need to make decisions based on fresh insights, not stale summaries. Even marketing ops folks are creating sophisticated analyses that would have required a dedicated data scientist just two years ago.
In this post, we’re going to cover the main open source Python dashboard libraries and frameworks and show you how to build and share a Python dashboard in minutes using Fabi.ai Smartbooks if you like things to be extra-easy.
If you’re reading this post, there’s a very good chance that you’ve dabbled in traditional business intelligence (BI). If you have, you’re also likely turning to Python for your next set of dashboards and workflows for a few reasons:
The real power comes from seamless integration. You explore your data in pandas, build your model in scikit-learn, and deploy your dashboard in the same Python environment. No translation layer, no data export headaches, no "it works in my notebook but breaks in production" surprises.
What Python dashboards enable that traditional BI can't:
And here's the kicker—AI excels at writing Python code. Unlike proprietary BI tools with their own query languages, Python is what AI was trained on. With the right framework, you can describe what you want in plain English and get production-ready code in minutes, not months.
Every data team has hit the wall with traditional BI tools. You need a custom calculation that doesn't fit their formula language. You want to visualize uncertainty in your predictions, but you're stuck with basic bar charts. You need real-time model predictions, but the best you can do is yesterday's batch results.
Python dashboards solve these problems by giving you the full power of the Python ecosystem. scipy for statistical computing, pandas for data manipulation, plotly for advanced visualizations, and any ML library you need for predictions. Your dashboard becomes an extension of your analysis, not a separate tool that forces you to dumb down your insights.
The workflow changes too. Instead of building a model in one tool, exporting results to another, and recreating visualizations in a third, everything happens in one unified environment. Your exploratory analysis naturally evolves into your production dashboard.
Dash was built specifically for data scientists who think in Python. It offers a rich ecosystem of visualization components and a reactive programming model that feels natural if you're already comfortable with Python development.
The community is strong, the documentation is thorough, and you have complete control over every aspect of your application. It's the tool of choice for teams with solid Python backgrounds who are building internal tools or proof-of-concepts where they have time to invest in learning the framework.
They have a detailed “Hello world” project to help get you off the ground in your local environment.
It does have one major downside: Expect a learning curve of several weeks to months for production-ready applications. You'll need to handle user authentication, responsive design, deployment infrastructure, and ongoing maintenance. It's powerful, but it requires significant time investment and typically some serious infrastructure or DevOps chops to deploy, and most importantly, maintain in an enterprise setting.
Streamlit's appeal is how fast you can get up and running locally—you can build a dashboard in just a few lines of code. It's perfect for quick demos, sharing results with stakeholders, or building simple internal tools where complex interactivity isn't required.
The syntax is incredibly simple, the deployment options are straightforward, and the growing ecosystem of community components means you can often find pre-built solutions for common needs.
Where Streamlit shines is in rapid prototyping and getting feedback quickly. Where it struggles is with complex interactivity and applications that need fine-grained control over user experience. The primary complaints with Streamlit have to do with how it handles states and loading. Things can start getting real sluggish when apps become even moderately complex.
They have a really great guide to getting started here.
If you’re willing and able to use front end libraries but want the back end powered by Python, the full web development route gives you complete flexibility. Flask or Django are the general go-to frameworks for this type of setup. You can integrate with any visualization library, scale to enterprise-level applications, and customize every pixel of the user experience.
The trade-off is complexity. Building interactive analytics applications this way traditionally requires an entire team of engineers and designers. You need expertise in backend development, frontend frameworks, database optimization, and DevOps. It's less about building dashboards and more about building full applications.
Most Python dashboard tutorials show you how to create a simple chart with sample data. Production dashboards are entirely different beasts. They need user authentication and role-based access control. They need to work on mobile devices. They need to handle real-time data updates, cache frequently accessed information, and gracefully handle errors when data sources go down.
The typical production dashboard timeline:
Based on what we see in the community, building a production dashboard typically takes 2-3 months for a team with existing Python experience. The final few weeks are testing, debugging, and polishing—the unglamorous work that separates a demo from a tool people actually want to use. And of course, with this also comes the ongoing maintenance which is oftentimes a much higher cost than the initial setup.
Python dashboard using these open source frameworks can absolutely be the right solution for teams that have the capacity and knowledge to build and maintain these. The flexibility is unlike any other solution.
At Fabi.ai, we love Python dashboards for all the reasons shared above. In a world of AI, there’s no question in our mind that BI-as-code is the future and that Python is the lingua franca. And as much as we love existing Python dashboard frameworks (we humbly recognize that we’re standing on the shoulder of giants), we don’t love the overhead and time required to get them up and running and shared with the rest of the business. This is why we built Fabi.ai. We’ve designed every piece so that you can go from raw data to a published dashboard in literally a matter of minutes (seriously, give it a try!)
In this very simple tutorial, we’ll walk you through how to create and publish your first Python dashboard using a Fabi.ai Smartbook.
Log in to Fabi.ai and create an account. You can create an account for free with no credit card, and corporate accounts get a 14 day free trial.
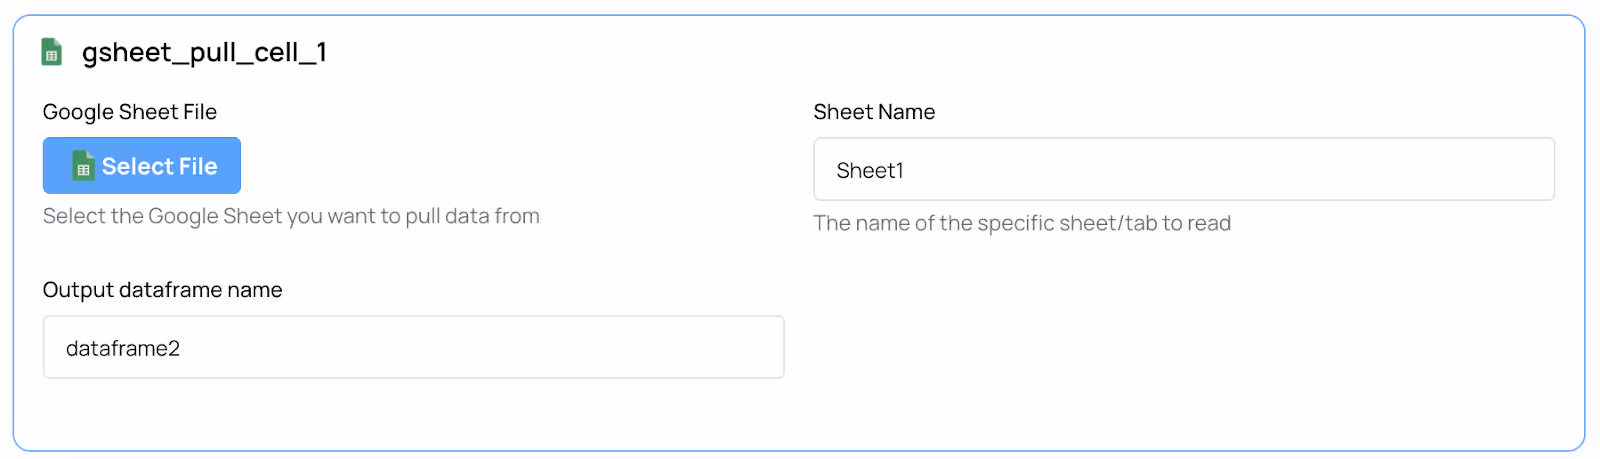
You can upload a file, but if you’re creating a dashboard, you probably want your data to refresh on schedule. You can either connect your database or data warehouse directly (we support all the most popular data sources and some) or you can connect to Google Sheets using our Google Sheets Pull cell
If you’re connecting to your database, create a SQL cell or ask the AI to pull some data for you. This will generate a SQL query and store your results as a Python Pandas DataFrame.
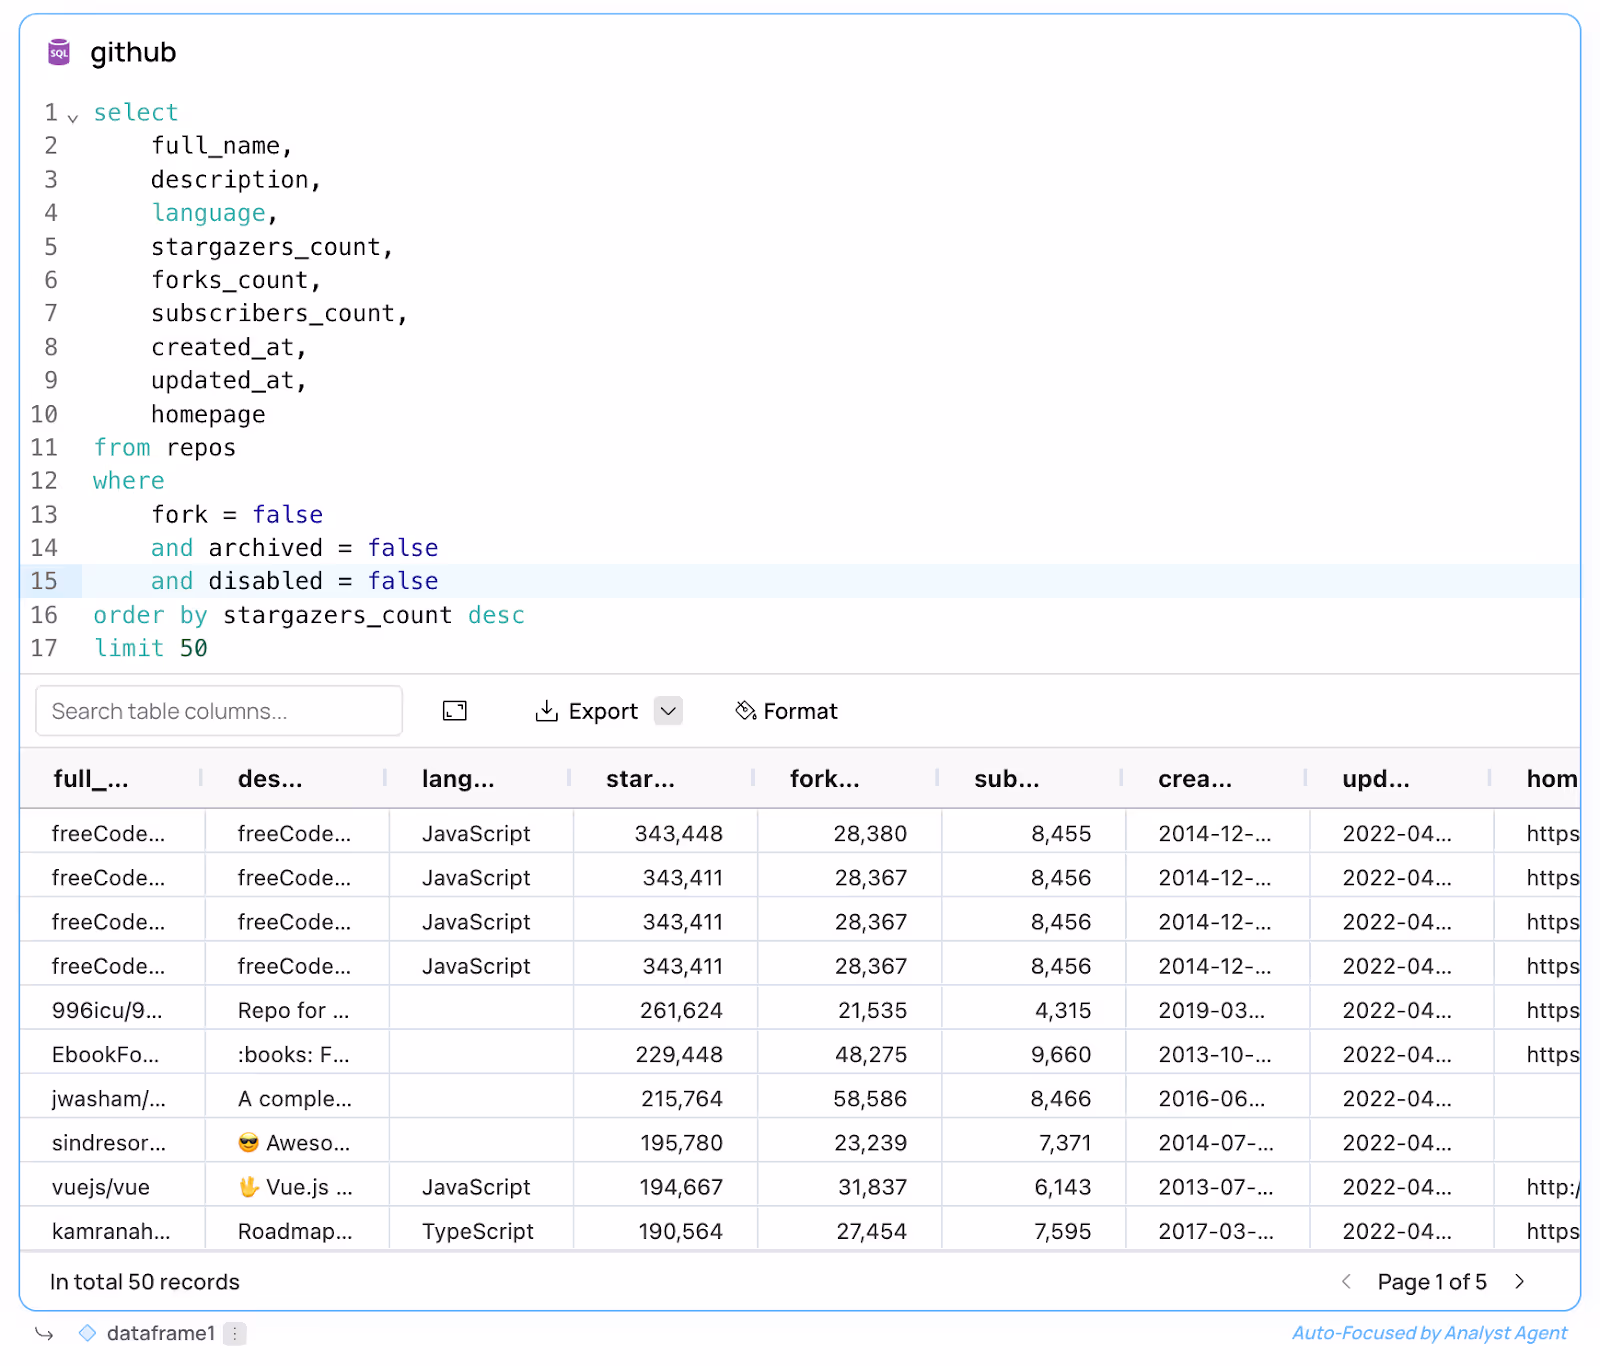
In the screenshot above we’re querying ClickHouse to pull a list popular GitHub repositories. The data is stored as dataframe1.
Once you’ve created your first cell to pull your data, ask the AI to generate a chart. In this case I simply asked the AI to show the number of times a repository was forked vs starred.
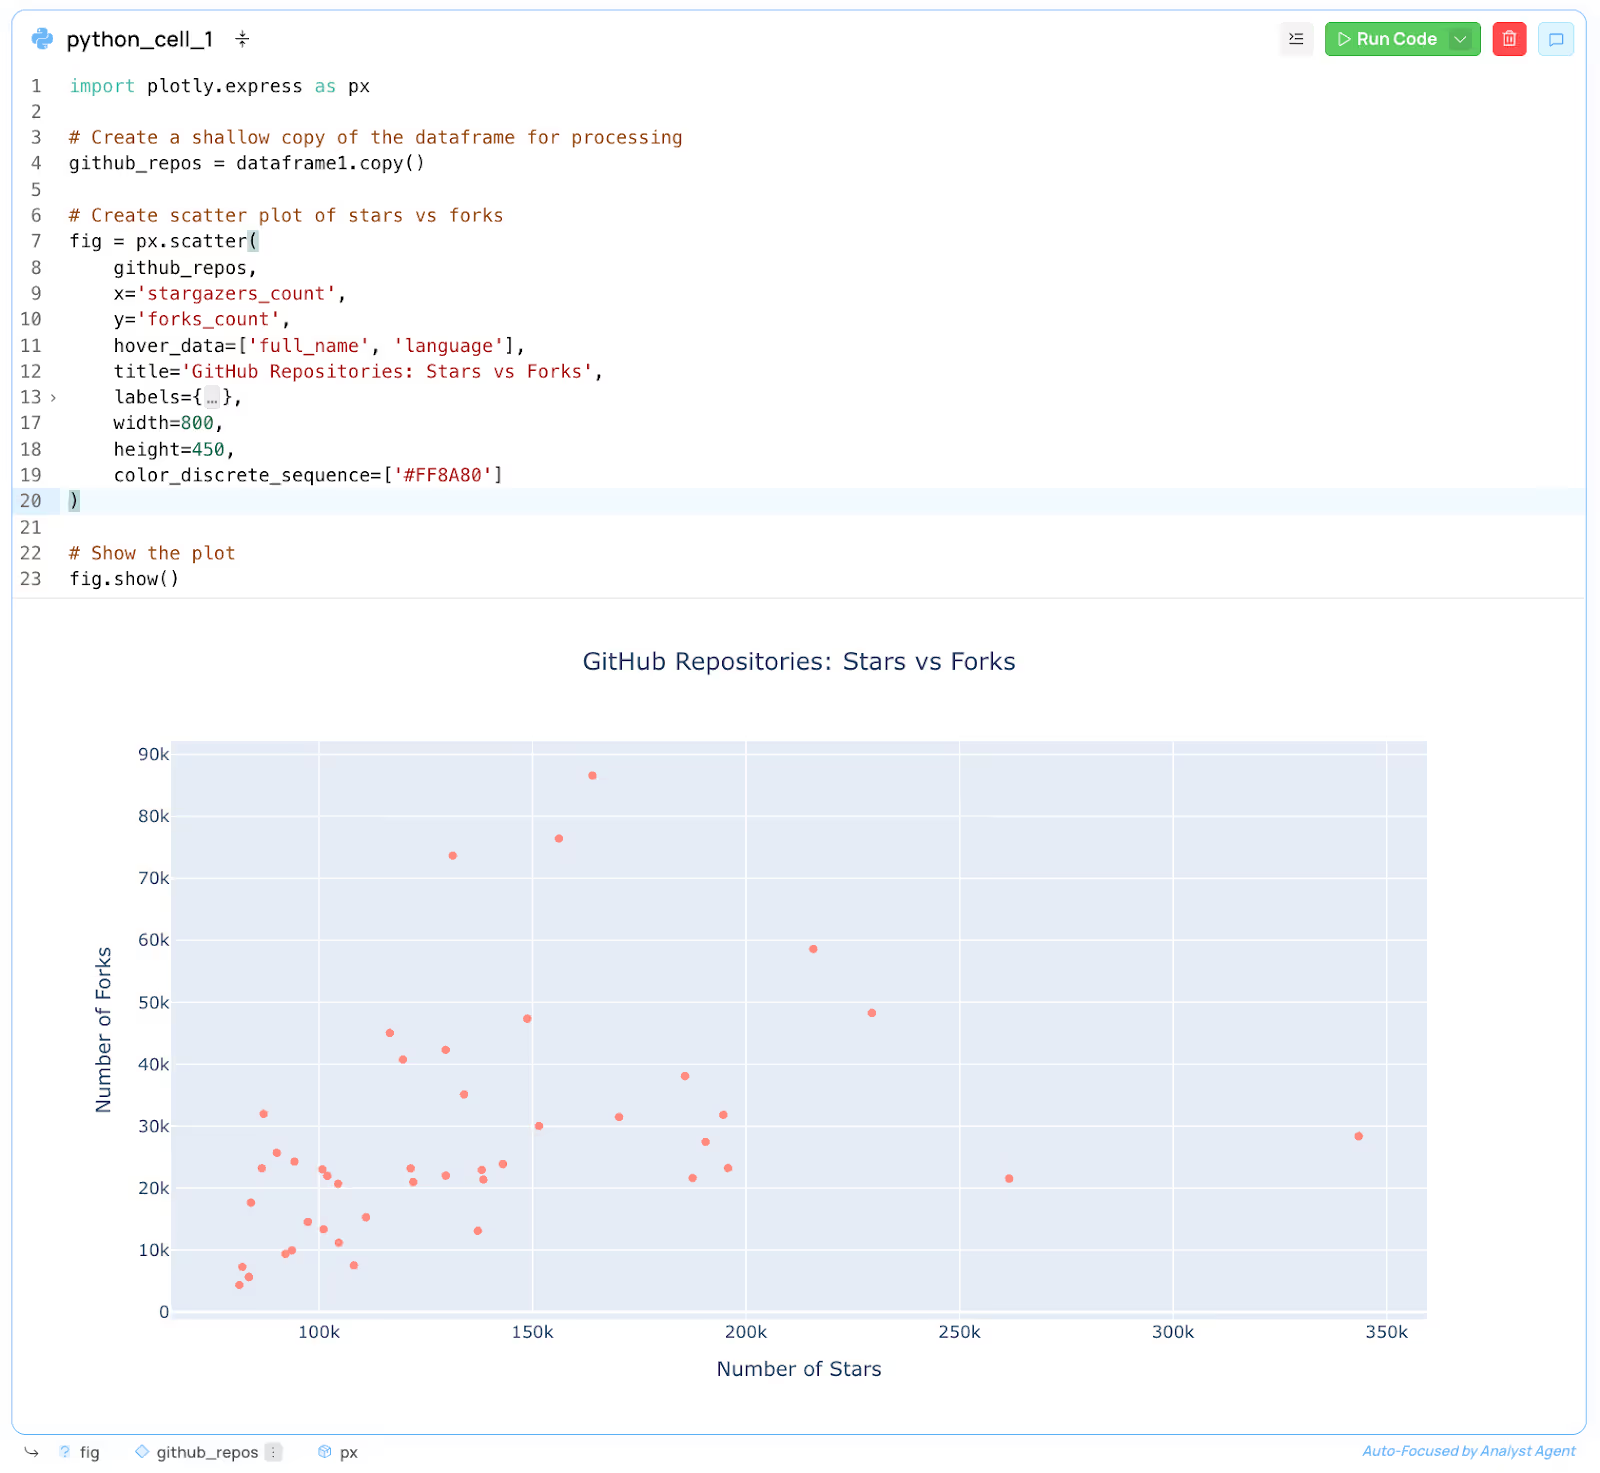
Again, since we’re using Python, you can ask the AI (or code yourself) all sorts of custom visualizations and models.
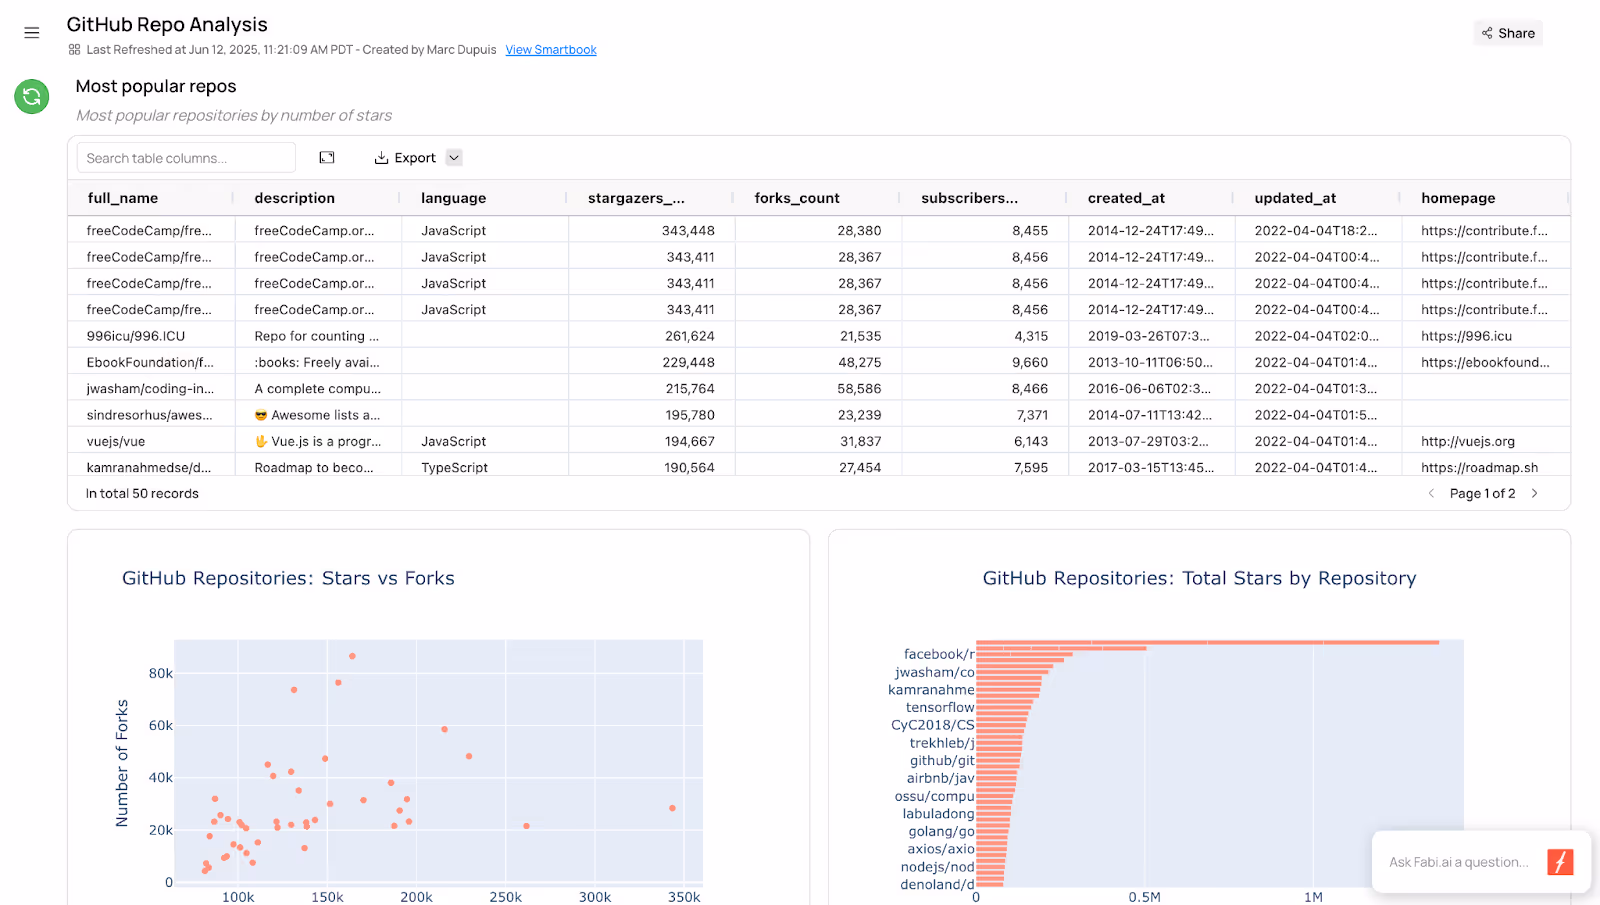
Once you have all the models, charts and insights that you want from your data and you’re ready to share with your team, simply click the Publish button in the top right hand corner. In the staging area you can move charts and tables around, add titles and labels, and even configure the AI Analyst Agent to help answer follow-up questions in your dashboard directly.
And of course, dashboards are no fun if they’re static. Adding filters and inputs is simple. You can add filters to SQL cells using Jinja templating or directly to Python cells using Python variables.
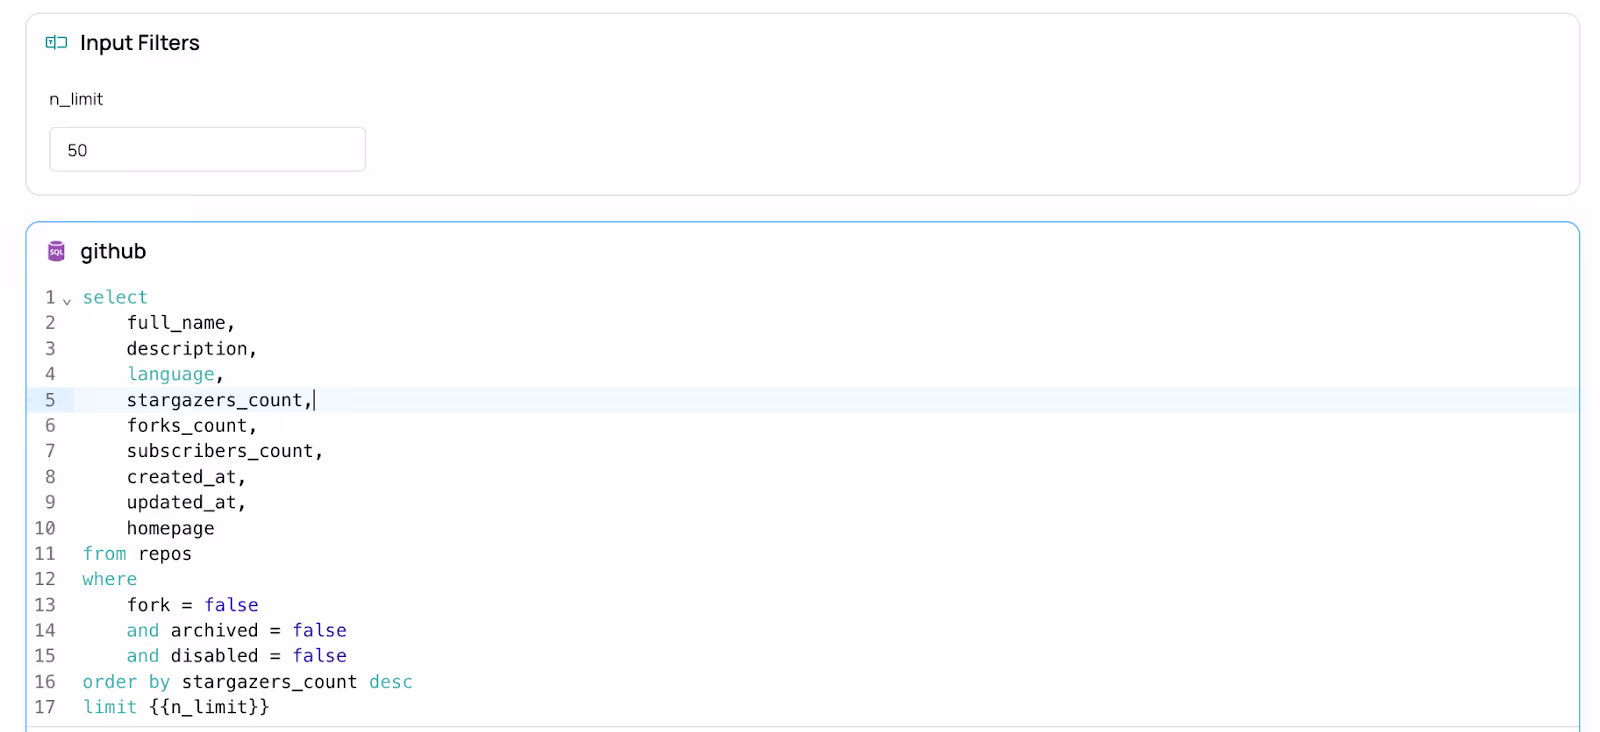
In this example, we’re letting the user pick the number of records to retrieve by passing the n_limit variable defined in the input filter above the SQL cell.
The right choice depends on your team's situation and priorities.
Build from scratch when:
Consider AI-powered platforms when:
Stick with traditional BI when:
Regardless of which approach you choose, some principles remain constant.
Data architecture essentials:
User experience fundamentals:
Security and scale planning:
The ecosystem continues to evolve rapidly. We're seeing AI-powered chart recommendations based on data patterns, natural language querying directly within dashboards, automated insight generation and anomaly detection, and real-time collaborative features for team data exploration.
At Fabi.ai, we’re extremely bullish on the future of BI-as-code, and Python dashboards in particular. We’re seeing everyone from startup founders to experienced data teams move in this direction and the value is becoming more obvious by the day.
The best dashboard is the one that actually gets built and used. Whether that's through weeks of careful framework development or minutes of AI-assisted generation, the choice is yours—and both approaches have their place in the modern data toolkit.
Ready to try building a dashboard? Start with your data and a clear goal. Define what questions you're trying to answer, understand who will be using the dashboard and how they'll interact with it, and then choose the approach that best fits your constraints and capabilities.
The shift from rigid BI reports to interactive, ML-powered dashboards isn't just a technical change—it's a fundamental shift in how we think about data in business. The tools are here, the AI is ready to help, and the only question left is what insights you'll uncover when you can finally ask your data the questions that actually matter.
To build your first Python dashboard in Fabi.ai for free, sign up today!


.avif)