
.svg)


How to share Jupyter or Google Colab notebooks (with examples)

TL;DR: Google Sheets are oftentimes the first database for any company. They're powerful, flexible and familiar. We touch on the pros and cons of staying on Google Sheets, and if you choose to stick with Google Sheets, we provide a simple step-by-step tutorial explaining how to use Fabi.ai to connect to Google Sheets and start building a dashboard. If you want to see it in action, you can skip right to our pre-built template.
If you're reading this, there's a good chance you're in charge of juggling a number of spreadsheets, and you've been asked to start turning these into dashboards for the team. Or perhaps you've already started venturing down that path and you started with a simple chart, added a few more visualizations, threw in some pivot tables, and before you knew it, you had a sprawling spreadsheet that takes forever to load and breaks every time someone adds new data.
Here's the thing—Google Sheets is incredibly powerful. Entire organizations run on them (whether or not anyone would readily admit it). Even here at Fabi.ai, we have our own set of canonical sheets. But turning these into dashboards isn't easy or elegant. And yes… at some point if you're building real, complex dashboards you should probably graduate to a data warehouse, but that doesn't work for everyone for a variety of reasons. Perhaps some spreadsheets require manual entry, or perhaps you don't have the budget for a data warehouse, or perhaps even more common, the business just wants to stay in spreadsheets.
Turning a series of Google sheets into a robust dashboards presents a few challenges:
In this post we'll talk a bit about the good and bad reasons to stay in Google Sheets when building dashboards, considerations if you do want to stay in Google Sheets, along with an AI-powered alternative to keep using Google Sheets are your data source of truth, but leverage the power of AI, Python and SQL to create fast, scalable, collaborative dashboards.
If you’re already convinced that you need to stay in Google Sheets and just want to learn how to build powerful, custom dashboards with the help of AI, jump ahead to the brief tutorial about Fabi.ai down below.
Not every situation calls for enterprise-level data warehouses and business intelligence (BI) tools. Here are some valid reasons to stick with Google Sheets:
Accessibility and familiarity: Your entire team already knows how to use Google Sheets. There's no learning curve, no additional software to install, and everyone can access it from anywhere. Data adoption can be challenging, if the team is already embracing a method, this shouldn’t be discounted.
Real-time collaboration: Multiple team members can view and edit the data simultaneously, making it ideal for smaller teams who need to collaborate on data entry and analysis.
Low budget solutions: For startups and small businesses, investing in expensive BI tools with a data warehouse might not be financially feasible yet.
Quick iteration: For simple reporting needs that change frequently, the ability to quickly modify formulas and charts can be valuable.
Integration with Google Workspace: If your organization heavily relies on Google's ecosystem, keeping everything in one place has its advantages.
Manual data entry: Certain teams need spreadsheets for manual entry purposes. It’s much easier to have a team work from a spreadsheet than build a tool on top of a data warehouse and teach a team how to use that tool.
"We've Always Done It This Way": Resistance to change isn't a good reason to stick with an inadequate solution. Despite the comment above about sticking to a familiar interface, if you’re jumping through hoops to make Google Sheets work but things keep breaking and there’s no way to maintain your dashboards as they scale, this point loses it’s weight.
Fear of data migration: Concerns about moving data to a new system often lead to procrastination on necessary upgrades.
Underestimating complexity: What starts as a simple dashboard often grows in complexity over time, and by then, you're too invested to change course easily. When spreadsheets and dashboards are breaking on a regular basis and you’re losing sleep and weekends over it, it’s probably time to make the switch.
Even the most meticulously designed Google Sheets dashboard will eventually hit limitations:
As your data grows, Google Sheets slows down dramatically. Once you exceed about 500,000 cells with formulas or have multiple complex charts, the lag becomes noticeable. At around 5 million cells, it becomes practically unusable.
QUERY functions and array formulas can perform amazing feats, but they become increasingly difficult to maintain as complexity grows. A single syntax error can break your entire dashboard, and troubleshooting becomes exponentially more difficult.
While Google Sheets charts have improved over the years, they still lack the customization options and visual appeal of dedicated visualization tools. You're limited to basic chart types and have minimal control over aesthetics.
Without proper version control, it's easy for team members to accidentally overwrite or break dashboard components. "Who changed the formula in cell C27?" becomes a common refrain.
Sensitive business data in Google Sheets can be accidentally shared with the wrong people or exported without proper controls, creating compliance and security risks.
If you're committed to staying with Google Sheets for now, here are some best practices to maximize its effectiveness:
So, you’ve decided to stay on Google Sheets but you want to build an interactive, custom dashboard. Let’s build this in Fabi.ai in just a few minutes.
If you want to follow along with an example, you can load our pre-built Google Sheets dashboard template.
Log in to https://app.fabi.ai/ and create your account. During the onboarding flow, or once you’ve logged in, you’ll be invited to connect to Google Sheets. This will create a Google Sheets cell. Simply authenticate with your Google account, select a spreadsheet and click Run. This will import your spreadsheet data as a Python DataFrame.
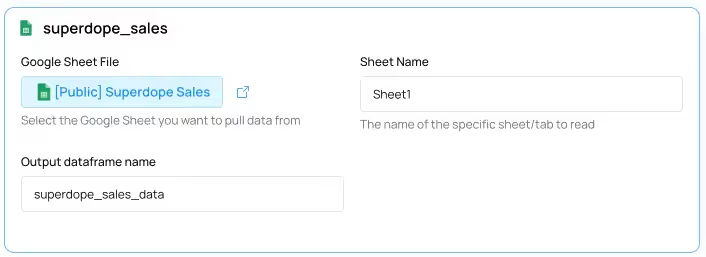
In this example we’re importing Superdope sales data and storing it as superdope_sales_data. Now that we have our data loaded, you can use Python to analyze it and create visuals. Better yet, you can use our AI to start exploring your data.
Fabi.ai Smartbooks bring together SQL, Python and AI. This is powerful, because you can start talking to your data in plain English but you still get the code.
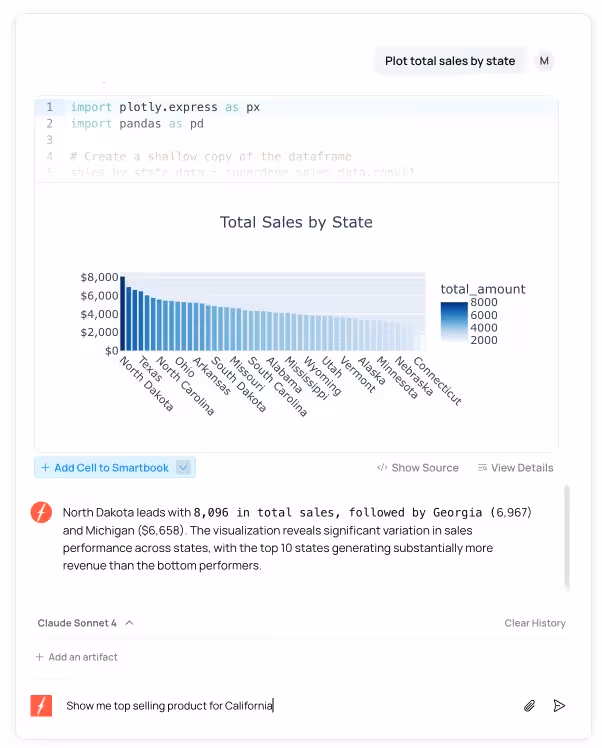
In the example above, we asked the AI to plot total sales by state, and it returned a chart, with underlying Python code. I can accept or reject the AI suggestions. If I accept the code, it will pin the code to my Smartbook.
Once you’ve completed your analysis and you have all the charts you want to include in your dashboard, it’s now time to turn this into a dashboard that you can share with your team.
In the top right hand corner, click on Publish. This will bring you to a staging area where you can move your charts around or resize them. You can even schedule your dashboard to refresh at a certain cadence.
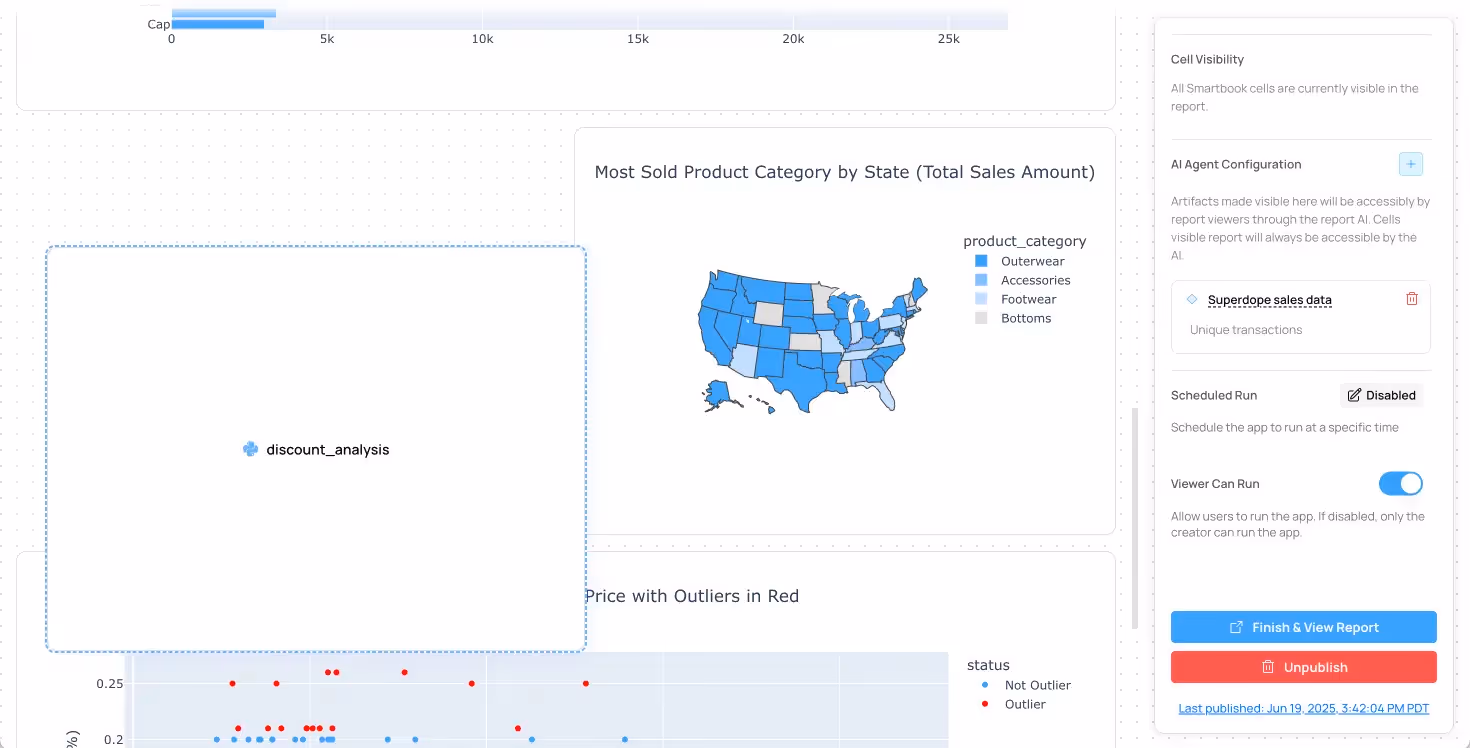
Once you’re happy with your dashboard, click on Finish & View Report, and that’s it! You can now share your dashboard with your coworkers. You now have an AI-generated Python dashboard powered by your Google Sheets.
A note on filters: All good dashboards take inputs and filters. We won’t dive into how to build these in detail in this post, but we have documentation along with a video, explaining how to add these.
Even with tools like Fabi.ai to extend Google Sheets' capabilities, there comes a point when a dedicated BI solution makes sense:
When you're regularly working with millions of rows of data, even the best Google Sheets optimization won't be enough. Consider these benchmarks:
If you recognize it's time to move beyond Google Sheets (even with Fabi.ai's help), here's how to plan your transition:
A move off of Google Sheets very likely means a move towards a data warehouse such as Snowflake, Databricks or BigQuery (just to name a few). These are great platforms. We love them at Fabi.ai, but they’re not cheap and they’re certainly not a low lift to implement and maintain. They generally require one or more full-time data engineers to keep running. We encourage you to look at these seriously when the signs are pointing you in this direction, but we feel it’s important to provide these disclaimers.
Every organization's data journey is different. Google Sheets remains a powerful tool for many use cases, especially when enhanced with solutions like Fabi.ai that bridge the gap between spreadsheet simplicity and advanced dashboard capabilities.
The key is recognizing where you are in your data maturity journey and making intentional choices rather than defaulting to what's familiar. Whether you're optimizing Google Sheets, leveraging Fabi.ai to extend its capabilities, or planning your transition to enterprise BI, the goal remains the same: turning data into insights that drive better business decisions.
To get started with dashboards on top of your Google Sheets today, you can hop in to Fabi.ai and get started for free in less than 5 minutes.


